AusGeo News March 2011 Issue No. 101
Australia’s coastline: adapting to climate change
Bob Cechet, Paul Taylor, Christina Griffin and Martyn Hazelwood
Assessing infrastructure vulnerability to rising sea-levels
Australia’s coastal zone includes major cities and supports major industries such as agriculture, fisheries, and tourism. The zone also includes coastal wetlands and estuaries, mangroves and other coastal vegetation, coral reefs, heritage areas and threatened species or habitats.
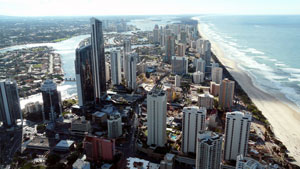
All of Australia’s major cities (except Canberra) will potentially be affected by rising sea-levels, higher tides and more frequent storms. Perth, Adelaide, Melbourne, Sydney, Brisbane, Darwin and Cairns all include low-lying areas and critically important commercial precincts, infrastructure, and very large numbers of residential properties (figure 1). Much of the residential and commercial infrastructure located near the coastal areas of these cities was built around the port facility which was, historically, the focal point of activity within the community. Most of the road and rail network dates from the early 20th century, and was built around the need for good harbour access both from the sea and the land.
Since the release of the Intergovernmental Panel on Climate Change (IPCC) Fourth Assessment in 2007 a considerable body of new data and observation has been compiled. In March 2009 a major climate conference was convened in Copenhagen by the International Alliance of Research Universities. The Conference Synthesis Report made a number of significant points, but had one over-riding message: ‘key climate indicators are already moving beyond the patterns of natural variability within which contemporary society and economy have developed and thrived’.
Figure 1. Aerial view of Gold Coast skyline (image courtesy of Wikipedia.org).
In 2008, researchers told the Parliamentary Inquiry into climate change and environmental impacts on coastal communities (Commonwealth of Australia 2009) that Australia’s coastline is especially vulnerable which echoed the sentiments expressed in the National Climate Change Adaptation Framework (NCCAF 2007). Adaptation to sea-level rise is therefore a key challenge, and includes coastal modification (erosion control measures), engineering solutions (barrages and weirs), or even re-location of communities.
Geoscience Australia has recently completed the ‘First-Pass’ Australian National Coastal Vulnerability Assessment (NCVA; Cechet et al 2011), which was commissioned by the Australian Government Department of Climate Change to assess the vulnerability of coastal communities to rising sea-levels. This first-pass national assessment includes an evaluation of the exposure of infrastructure (residential and commercial buildings, as well as roads and major infrastructure such as airports) to sea-level rise and storm tide.
The threat
More than 80 per cent of Australians live within the coastal zone. Chen & McAneney (2006) estimate that approximately six per cent of Australian addresses are within three kilometres of the shoreline and in areas less than five metres above mean sea-level (about 700 000 residences; Commonwealth of Australia 2009). In addition, a significant number of Australia’s ports, harbours and airports would be under threat. A number of important environmental, biological and heritage sites are situated within the coastal zone, and tourism is a major industry.
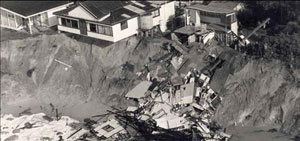
Figure 2. Coastal erosion at Wamberal beach, New South Wales, in 1978.
| Causes and effects of rising sea-levels |
| Tides and storm surges: Climate change will not be a simple, uniform warming process, but will vary from region to region. Changing climate will bring changing weather, with associated changes to wind strength and direction affecting storm tides riding on raised sea-levels.
Ocean currents: Currents on the Australian west and east coasts will strengthen as more heat is transported from the tropics to the mid-latitudes resulting in impacts on coastal ecosystems.
Inundation: Even if the sea were totally calm, significant areas of Australia’s coastline will be flooded if sea-levels rise as predicted.
Erosion: Soft coastlines are potentially mobile because of rising sea level.
Salinisation: Groundwater, estuaries, lakes and rivers will be ‘invaded’ by salty sea water, altering and causing massive changes to coastal ecosystems. |
Assessing coastal vulnerability at the national scale
Adapting to climate change and coastal variation will be a major challenge for communities and governments in the 21st century. The first requirement for meeting this challenge is accurate knowledge of the coastal zone and its properties as well as knowledge of the infrastructure (that is, a comprehensive national set of underpinning data).
As data collection is usually based within local and state jurisdictional boundaries, Geoscience Australia has managed the development of two nationally consistent databases describing Australia’s infrastructure assets and coastal geomorphology. These databases (NEXIS and Smartline) contain information collected from local and state government agencies, scientific institutions and the private sector which has been reformatted into a consistent standard to allow national-scale assessments.
The National Exposure Information System
The National Exposure Information System (NEXIS) is a significant national initiative being developed at Geoscience Australia. The system is capable of providing the necessary information about infrastructure exposure for risk assessments by supplying comprehensive and nationally consistent data. It has been categorised into residential, business (commercial and industrial), institutions and transport infrastructure (roads; highways, local roads and unsealed roads; rail, ports and airports). This information has been collated at the local level and has been applied at the national scale using reasonable and logical assumptions and expressions.
NEXIS is derived primarily from reliable and publicly available datasets, and maintains information that spatially locates buildings and infrastructure and their attributes and is compatible with multi-hazard vulnerability assessment models. NEXIS also provides nationally consistent generic infrastructure exposure information (at building level) derived from statistical sampling of data-rich regions and supplies the output nationally through a set of rules and assumptions. The information has already been applied for a range of threats anywhere along Australia’s coast, including sea-level rise, extreme weather, and other threats to communities and infrastructure.
Smartline
The National Coastal Landform and Stability Mapping Tool (Smartline) was created by a team of specialists at the University of Tasmania and is managed by Geoscience Australia. Smartline is an accurate representation of the high-water mark around the coast. Information is embedded in a line map in detailed segments so that the landform type, bedrock geology and exposure of the coast to wave action can be identified. The line classifies the backshore, intertidal and subtidal zones, and is segmented each time a change in the coastal environment attributes occurs.
As part of the NCVA, Smartline has been used to classify coastal zones that are potentially unstable (based on the geomorphology), and therefore more susceptible to the effects of sea-level rise, including coastal erosion and recession. One of the expected impacts from climate change is accelerated coastal recession due to rising sea-levels, although rates and location of recession are highly dependent on several factors. These include the inherent susceptibility of differing coastal landform types, regional variations in the processes driving erosion/recession or instability (for example, sea-level rise and wave climate), and local factors such as topography and sediment budgets. An example of the impact of coastal erosion on residential infrastructure is shown in figure 2. In 1974 and 1978, the Wamberal beach region of central New South Wales suffered significant coastal erosion because of wave energy associated with severe Tasman Sea storm events.
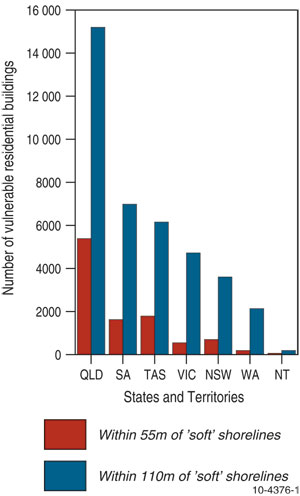
Figure 3. Number of residential buildings (by state and territory) located within 55 and 110 metres of ‘soft’ shorelines (simulating the average and maximum extents of coastal recession by 2100).
Smartline has been used to determine the length of each landform stability class in Australia. Approximately 63 per cent of the Australian coast is composed of either sandy or muddy shores. The remainder is composed of ‘soft’ rock or ‘hard’ rock shores. Approximately 47 per cent of sandy and muddy shores are backed by soft sediments (as opposed to bedrock) and are therefore potentially mobile. This is a significant statistic as it encompasses shores which are both unimpeded by human structures and those in more built-up areas where migration of ‘soft’ shorelines will generate planning and management issues for communities. Sandy shores make up 30 per cent of the ‘free-moving’, unimpeded shores while the remaining 17 per cent are muddy shores. The identification of potentially mobile shores is significant for the implementation of successful coastal planning for climate change adaptation.
Residential infrastructure vulnerable to erosion
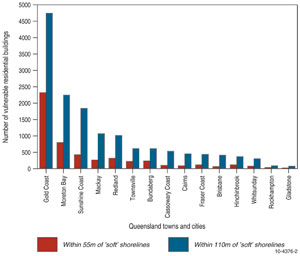
By identifying soft and potentially erodible shores the Smartline was used to develop Zones of Potential Instability (ZPI). Using the sea-level rise scenario outlined on page 5, the ZPIs were used to generate a new potential shoreline position. This shoreline position was integrated with NEXIS to determine the number of buildings which would be vulnerable to recession. Utilising the simple Bruun Rule (Bruun 1962) for recession (that is, recession distance equals 100 times the sea-level rise height) as the risk-averse scenario and half this distance as the risk-tolerant scenario and based on a sea level rise of 1.1 metres by 2100, we assumed that ‘soft’ shorelines could recede between 110 and 55 metres inland respectively. Figure 3 shows the number of residential buildings (by state or territory) located within 55 and 110 metres of ‘soft’ shorelines The number of residential buildings in Queensland (by local government area or LGA) located within 55 and 110 metres of ‘soft’ shorelines is shown in figure 4. Across Australia, nearly 39 000 residential buildings are located within 110 metres of potentially erodible shorelines, with nearly 40 per cent of those buildings located in Queensland. There was no consideration of any existing, planned or future protective structures associated with the estimates of buildings at risk by 2100. Local sediment processes, such as accretion, were not considered.
Figure 4. Number of residential buildings in Queensland (by LGA) located within 55 and 110 metres of ‘soft’ shorelines (simulating the average and maximum extents of coastal recession by 2100).
Inundation mapping
An assessment of the vulnerability of the coast to inundation requires an accurate understanding of coastal elevation. A Digital Elevation Model (DEM), which represents in a national-scale map the height above sea-level for each grid cell, was a key dataset for a national assessment of potential coastal inundation. Elevation data and modelling options were assessed by the Spatial Information Council and the Cooperative Research Centre for Spatial Information (CRCSI). The Australian Government decided to invest in a mid-resolution DEM covering the entire coast derived from SPOT High Resolution Stereoscopic Reference3D satellite imagery.
The SPOT DEM has a horizontal resolution of approximately 30 metres (that is, 30 metres by 30 metres elevation grid) and a vertical height resolution of one metre (that is, elevation of the surface is in intervals of one metre in height). Limited localised comparisons with high resolution LiDAR (Light Detection and Ranging) elevation data (approximately 10 to 15 centimetres vertical accuracy and a horizontal resolution in the order of metres) indicated that the SPOT DEM generally provided an adequate representation of the shape of coastal elevation. This applied even if the SPOT DEM heights were not exactly correct, however relative patterns of inundation could be obtained. For a whole of continent ‘first-pass’ national analysis the SPOT data was assessed as ‘fit-for-purpose’.
The core data elements of the inundation mapping were:
- Sea-level rise (SLR) estimated as a maximum of 1.1 metres by the year 2100 was selected for this assessment. This was based on the plausible range of sea-level rise values from research since the IPCC Fourth Assessment Report and because nearly all of the uncertainties in sea-level rise projections operate to increase rather than lower estimates of sea-level rise (Department of Climate Change 2009). This should be considered a high-range estimate of SLR suitable for long-term planning purposes.
- Storm tide was estimated from models using observations from tide gauges, global tide data and wind models. Storm tides data for one in 100 year events were provided for Victoria, Tasmania and New South Wales (McInnes et al 2009A). Storm tide values are the estimated current climate ‘one in 100 year storm surge’ value combined with the normal tidal component. McInnes et al (2009B) considered the frequency of extreme events in south-eastern Australia and found that storm surges, which occur once in 100 years at present, could now be expected on average once every 40 years by 2030. The impact of climate change on storm tide is not being considered in this first-pass study.
- Mean High Water Level and observed/recorded storm tide. For remaining areas (Northern Territory, Queensland, South Australia and Western Australia), tidal heights were obtained from continent-wide tidal height predictions (essentially modelled Mean High Water Level values) from the National Tidal Centre at the Bureau of Meteorology.
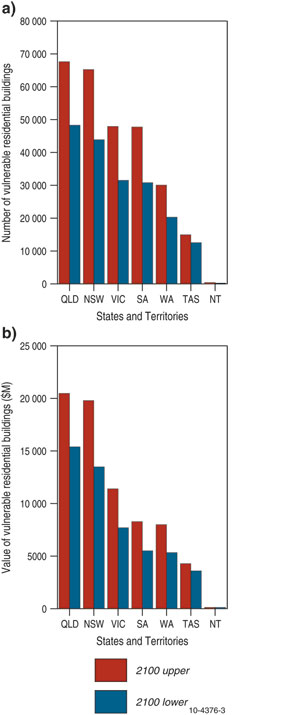
Figure 5. Number (a) and value (b) of potentially vulnerable residential buildings (by state and territory) considering the combined impacts of both inundation (1.1 metre sea level rise (SLR) and storm tide) and recession (Bruun rule; 100 times SLR). Values are based on the ‘upper’ and ‘lower’ estimates derived by localised validation/comparison utilising LiDAR elevation data.
Modelling coastal vulnerability
The assessment methodology involved modelling the area of coastal inundation by projecting inland an undisturbed and level seawater surface (‘bath tub approach’) which utilised the previously described data inputs and the SPOT DEM. The resulting coastal inundation polygons were integrated with NEXIS to provide an analysis of vulnerability, in terms of potentially affected property and infrastructure and the cost of replacement. Counts of the number of residential and commercial buildings located within the inundation polygons and their replacement value were provided as well as the lengths of road and rail infrastructure and their values. Building counts/values and road/rail lengths/values were assessed at local government area (LGA) for an upper and lower end estimate of vulnerability. These were derived by undertaking comparisons of inundation footprints generated using the higher vertical/horizontal resolution LiDAR elevation data (where available) with those derived using the SPOT DEM to capture uncertainty in the estimates.
The Zones of Potential Instability were then integrated with the coastal inundation polygons to estimate the combined impact of inundation and potential recession. This analysis does not include the potential impacts of inland flooding converging with coastal (ocean) inundation. Convergence of inland flooding and coastal inundation could greatly increase the areas potentially inundated.
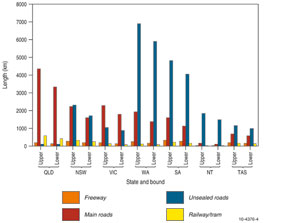
Table 1 shows the vulnerability of residential infrastructure (by state or territory) considering inundation and erosion impacts both separately and when combined. Queensland and New South Wales have the greatest vulnerability when considering both the value of the infrastructure and also the number of buildings affected. Figure 5 shows the number and replacement value of potentially vulnerable residential buildings (by state and territory) considering the combined impacts of both inundation and recession. Nationally, residential buildings valued at $64 billion are vulnerable to inundation, and this value increases to $72 billion when considering the combined vulnerability to both inundation and recession. Figure 6 shows the length (in kilometres) of vulnerable roads and railway (by state or territory) considering the combined impacts of both inundation and recession. The more populous states of Queensland, New South Wales and Victoria figure prominently with regard to vulnerability. For figures 5 and 6, the values are based on the ‘upper’ and ‘lower’ estimates derived by localised validation/comparison utilising LiDAR elevation data.
Table 1. Number and value of residential buildings vulnerable to the impacts of coastal inundation, recession and the combination of inundation and recession for all states and the Northern Territory. The values consider a sea-level rise of 1.1 metres by 2100 in combination with a sea-level increase from a one in a 100 year return-period storm surge event (for New South Wales, Victoria and Tasmania) and the spring high-water tide for all other states. Values are based on the ‘upper’ estimates derived by localised validation/comparison with LiDAR elevation data.
| State |
‘Inundation’ only
|
‘Recession’ only(Zone of Potential Instability)
|
Inundation + Recession (Zone of Potential Instability)
|
|
Number |
Value ($mil) |
Number |
Value ($mil) |
Number |
Value ($mil) |
| New South Wales |
62 400 |
19 000 |
3 600 |
1 260 |
65 200 |
19 800 |
| Northern Territory |
200 |
60 |
200 |
80 |
400 |
130 |
| Queensland |
56 900 |
16 000 |
15 200 |
5 800 |
67 700 |
20 500 |
| South Australia |
43 000 |
7 400 |
7 000 |
1 300 |
47 800 |
8 300 |
| Tasmania |
11 600 |
3 300 |
6 100 |
1 800 |
14 900 |
4 300 |
| Victoria |
44 700 |
10 300 |
4 700 |
1 450 |
48 000 |
11 400 |
| Western Australia |
28 900 |
7 700 |
2 100 |
600 |
30 000 |
8 000 |
| AUSTRALIA |
247 700 |
63 760 |
38 900 |
12 290 |
274 000 |
72 430 |
Impact of population pressures on vulnerability to inundation/recession
The Australian Bureau of Statistics (ABS 2009) suggests that Australia’s population will increase to between 30.9 and 42.5 million people by 2056, and between 33.7 and 62.2 million people by 2101. It is predicted that a large percentage of this increased population will live in the coastal zone (as at present), particularly if climatic predictions of higher inland temperatures are correct. Along the eastern seaboard in particular, the coastline is developed for residential use and is heavily populated. Increased population will put greater pressure on the coastal zone, and this gives a particular urgency to the need for adaptation to rising sea-levels.
The ABS population projections simply illustrate the growth and change in population that would occur if certain scenarios about future levels of fertility, mortality, internal migration and overseas migration were to prevail over the period of the projection (that is, in a similar way to the climate projections/scenarios). These assumptions incorporate recent trends which indicate increasing levels of fertility and net overseas migration to Australia. Three main series of projections-the ABS’s Series A, B and C-are utilised. Series B largely reflects current trends in fertility, life expectancy at birth, net overseas migration and net interstate migration, whereas Series A and Series C are based on the high and low assumptions for each of these variables respectively. As Australia is considered by the rest of the world to be a sparsely populated continent, the combination of global climate change and global population pressures could lead to acceptance of more overseas migration. This would make projections at the higher end of the range (Series A) more likely.
Figure 6. Length (in kilometres) of vulnerable roads/railway (by state and territory) considering the combined impacts of both inundation (1.1 metre SLR and storm tide) and recession (Bruun rule; 100 times SLR). Values are based on the ‘upper’ and ‘lower’ estimates derived by localised validation/comparison with utilising elevation data.
Considerable research has been carried out by Geoscience Australia and others investigating levels of occupancy, housing construction methods, and household income, with a view to compiling a nationwide measure of the cost of replacement of assets. Existing commercial property databases (such as CityScope) covering the main urban centres have been supplemented by Geoscience Australia’s research. For this study we have used the Series A, B and C population projections to illustrate the change in exposure with respect to residential structures. Projections of residential infrastructure exposure (within NEXIS) maintain the current ratio of people (occupants) per building within each statistical local area (1500 plus regions across Australia). In addition, for the period post-2056, we have maintained the ratio of local to national change in order to maintain the 2056 local trend (for each series) up to the end of the 21st century. The current ratio of people per building has been gradually reducing over the past four decades; however for this task we have maintained it at current levels. We believe this is a realistic assumption as it is counteracted by the recent trend of increasing medium density (multi-storey) developments, which have a lower vulnerability to inundation.
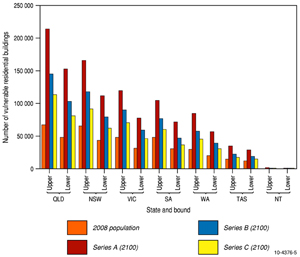
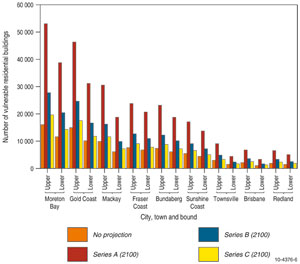
Figure 7 shows the number of vulnerable residential buildings (from inundation and recession) under the 2100 projected sea-level and current (2008) population as well as the ABS Series A, B and C population projections. Potential vulnerability is significantly increased by the ABS Series A and B population projections. In fact for the Series A projection the increase in sea-level has a smaller impact on the vulnerability compared to the increase in population (see figure 7; note the additional part of the bar above the level for 2100 sea-level and 2008 population). For the Queensland region, Figure 8 shows the number of vulnerable residential buildings (from inundation and erosion) for the most impacted LGAs (considering the 2100 sea-level with the 2008 population, and also ABS Series A, B and C population projections). The south-east corner of Queensland where most of the vulnerability for residential infrastructure is located (see figure 8), is currently experiencing large population growth and an associated building boom. All along the entire eastern seaboard, including South East Queensland, adaptation to rising sea-levels is becoming a priority for local councils battling to implement sound controls as increased population puts greater pressure on the coastal zone.
Figure 7. Number of vulnerable residential buildings (from inundation and recession) under 2100 sea-level using the current (2008) population and also the ABS Series A, B and C population projections.
Summary and Conclusions
The Australian Government has developed a three-part response to climate change:
- helping to shape a global conclusion
- reducing Australia’s greenhouse gas emissions
- adapting to unavoidable climate change.
Adaptation recognises that, whatever policy decisions are made at present, some degree of climate change has become inevitable, and therefore some adaptation to this is equally inevitable. Australia’s long coastal zone is particularly vulnerable, and the capacity to adapt will be of critical importance.
The National Coastal Vulnerability Assessment (NCVA), which is part of the government’s adaptation plan, has provided an assessment of the future implications of climate change for Australia’s coastal zone, with a particular focus on coastal infrastructure and settlements. Further information on the study, including a breakdown of results for each state and territory by LGA with regards to the residential, commercial and road/rail vulnerability, can be found on the NCVA webpage which is located on Geoscience Australia’s OzCoasts website. The NCVA will inform the Australian Government’s consideration of national priorities for adaptation to reduce climate change risk in the coastal zone.
Figure 8. Number of vulnerable residential buildings (from inundation and recession) in Queensland (by LGA) under 2100 sea-level using the current (2008) population as well as the ABS Series A, B and C population projections.
The NCVA has:
- Provided an initial assessment of the implications of climate change for nationally significant aspects of Australia’s coastal regions (national overview and for key regions).
- Identified national priority regions to support effective adaptation policy responses in the coastal zone.
- Identified key elements of a nationally coordinated approach to reducing climate vulnerability and risk in the coastal zone.
- Located and begun the process of remedying shortfalls in research, as well as creating a national standard for comparison.
In collaboration with state and local governments and private industry, this assessment will provide information for application to policy decisions for, inter alia, land use, building codes, emergency management and insurance applications.
For more information email ausgeo@ga.gov.au
References
- ABS (Australian Bureau of Statistics). 2009. Population Projections, Australia, 2006 to 2101. Available at: www.abs.gov.au/Ausstats/abs@.nsf/mf/3222.0
- Brisbane Times. 2009. Available at: www.brisbanetimes.com.au/opinion/society-and-culture/south-east-queensland-beautiful-one-day-now-a-building-site-20091120-ip9u.html
- Bruun P. 1962. Sea-level rise as a cause of soil erosion. American Society of Civil Engineering Proceedings. Journal of Waterways and Harbours Division 88: 117-30.
- Cechet RP, Hazelwood MC, Anderson H, Dunford M, Power L, Jones T, and Nadimpalli K. 2011. Impacts of climate change on human settlements and other nationally significant infrastructure: National Coastal Vulnerability Assessment. Geoscience Australia Record.
- Chen K & McAneney KJ. 2006. High-resolution estimates of Australian coastal population. Geophysical Research Letters 33: L16601, doi:10.1029/2006GL026981.
- Commonwealth of Australia. 2009. Managing our coastal zone in a changing climate: the time to act is now. Parliamentary Inquiry into climate change and environmental impacts on coastal communities. House of Representatives Standing Committee on Climate Change, Water, Environment and the Arts, October 2009. Available at: www.aph.gov.au/house/committee/ccwea/coastalzone/report.htm
- Department of Climate Change. 2009. National Coastal Risk Assessment. Available at: www.climatechange.gov.au/government/initiatives/australias-coasts-and-climate-change/adapting/national-coastal-risk-assessment.aspx
- McInnes KL, O’Grady JG & Hubbert GD. 2009A. Modelling sea-level extremes from storm surges and wave setup for climate change assessments in southeastern Australia. Journal of Coastal Research SI56: 1005-09.
- McInnes KL, Macadam I, Hubbert GD & O’Grady JG. 2009B. A Modelling Approach for Estimating the Frequency of Sea-level Extremes and the Impact of Climate Change in Southeast Australia. Natural Hazards 51: 115-137, doi:10.1007/s11069-009-9383-2.
- NCCAF. 2007. National Climate Change Adaptation Framework. Available at: www.coag.gov.au/coag_meeting_outcomes/2007-04-13/docs/national_climate_change_adaption_framework.pdf
Related websites/articles
International Alliance of Research Universities. The Synthesis Report of the Conference
OzCoasts
www.cmar.csiro.au/sealevel/sl_hist_intro.html


