Rolling back carbon tax not hard-Abbott
Apr 02, 2012 01:37 pm
Tony Abbott is prepared to pursue a double dissolution if needed to repeal the government’s carbon tax.
Apr 02, 2012 01:37 pm
Tony Abbott is prepared to pursue a double dissolution if needed to repeal the government’s carbon tax.
|
||
| The dangerous implications of India’s nuclear romance Cogeneration & On-Site Power Production Magazine Efforts are on to squelch the months-long peaceful movement by villagers living in the neighbourhood of the Kudankulam nuclear plant in Tamil Nadu which has delayed its commissioning. What brought the people out of their homes is the fear that the … See all stories on this topic » |
||
| Feds eyeing Chalk River site for nuclear waste burial CTV.ca A warning sign posted at the AECL plant in Chalk River, Ont. is seen in this Dec. 19, 2007 file photo. (Fred Chartrand / THE CANADIAN PRESS) OTTAWA — Enough nuclear waste to fill more than a hundred Olympic-sized swimming pools could be buried in an … See all stories on this topic » |
This once a day Google Alert is brought to you by Google.
Report following disaster last March finds waves pose bigger threat than previously thought and could inundate Pacific coast
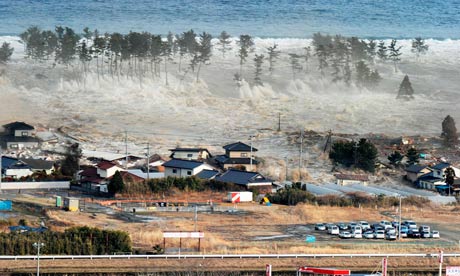
Much of Japan‘s Pacific coast would be inundated by a tsunami more than 34 metres (112 feet) high if an offshore earthquake as powerful as last year’s occurred, according to a government panel of experts. They report that a wave of such height could result from any tsunami unleashed by a magnitude-9.0 earthquake in the Nankai trough, which runs east of Japan’s main island of Honshu to the southern island of Kyushu.
An earlier forecast in 2003 put the potential maximum height of such a tsunami at less than 20 metres (66 feet).
The revised tsunami projections, contained in a report posted on a government website, are based on research following last March’s magnitude-9.0 earthquake and tsunami, which spawned a 14-metre (45-foot) wave that devastated most of Japan’s northeastern coast, triggered meltdowns at a nuclear power plant and killed around 19,000 people.
The catastrophe and the ensuing crisis at the Fukushima Daiichi nuclear power plant, prompted sweeping reviews of Japan’s disaster preparedness and criticism over apparent failures to take into account potential risks.
The tsunami knocked out power at the 40-year-old coastal nuclear plant, leading to the worst nuclear disaster since Chernobyl in 1986. Tens of thousands of residents have had to leave the area, and it is unclear whether some will ever be able to move back.
The Fukushima plant was designed to withstand a 6-metre (20-foot) tsunami, less than half the height of the surge that hit it on 11 March, 2011.
The latest forecast shows a tsunami of up to 21 metres (69 feet) could strike near the Hamaoka nuclear plant on the south-eastern coast. Its operator, Chubu Electric Power Co, is building an 18-metre (59-foot) high sea wall to counter tsunamis. The wall is due to be completed next year.
The plant was shut down in 2011 due to estimates it has a 90% chance of being hit by a magnitude 8.0 or higher quake within 30 years.
Oil Price Daily News Update
|
Researchers Base New Wind Turbine Control System on Human Memory
Posted: 01 Apr 2012 08:45 AM PDT
Apr 02, 2012 06:52 am
Flood-ravaged Fiji is bracing for more bad weather and a potential cyclone to his the island of Viti Levu.
Apr 02, 2012 06:46 am
Russian authorities have rescued six hundred and seventy five fishing enthusiasts from a sheet of ice.
A RESPONSE TO OLLIER’S ARTICLE “CSIRO ALARMISM MORE DANGEROUS THAN CO2” (THE AUSTRALIAN 27.3.2012)
I refer to the article by Ollier (27.3.2-12) titled “CSIRO alarmism more dangerous than CO2” (http://www.theaustralian.com.au/national-affairs/opinion/csiro-alarmism-more-dangerous-than-co2/comments-e6frgd0x-1226312898312), where the writer states: “The CSIRO projection is extreme, but before explaining why, I would note that the world’s main source of alarmism is the Intergovernmental Panel on Climate Change. This is not really a scientific body but one that adjusts data and subjects it to mathematical modeling before passing its “projections” on to politicians.”
The IPCC reports represent summaries of thousands of peer review papers in scientific journals, as well as reports by reputable science bodies, including the CSIRO. Here I examine the basis for some of Ollier’s claims:
However, sea levels over the past eight years have not been constant:
Referring to the title of Ollier’s piece, since the connection between atmospheric CO2, global temperatures and sea levels is an established observation in paleo-climate science, the warnings arising from climate science of global sea level rise consequent on continuing carbon emissions can no longer be refuted.
(Dr) Andrew Glikson
1.4.2012