Posted: 11 Aug 2012 08:13 PM PDT
Week ending 12 August 2012
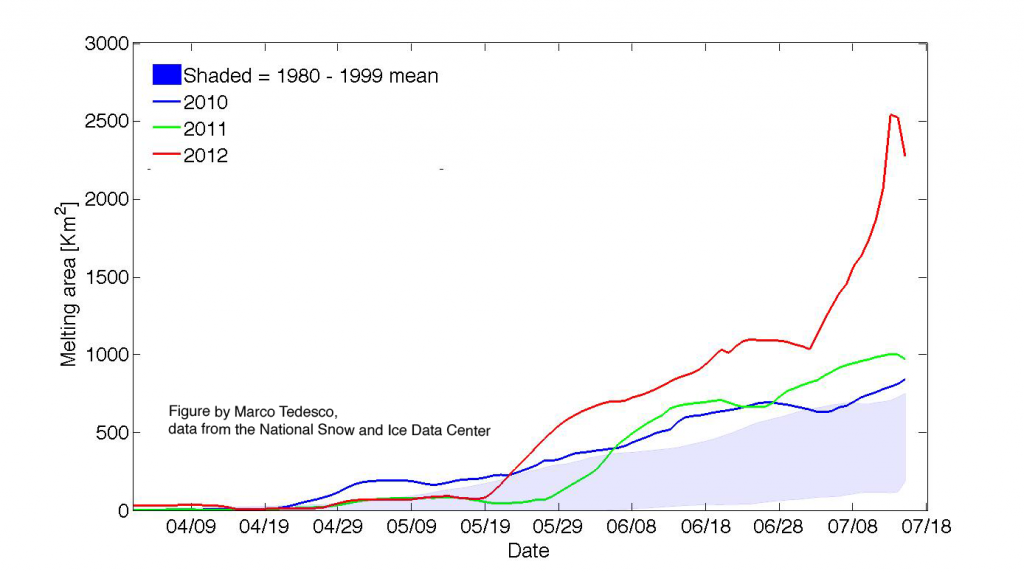 |
| Extensive melt over the Greenland Ice Sheet. This figure shows the daily, cumulative area of the Greenland ice sheet showing surface melt for 2012, 2011, 2010 and for the 1980 to 1999 mean. While melt was unusually extensive through May and June of 2012, the melt area increased rapidly in early July in response to an unusually warm weather event. Source: http://nsidc.org/arcticseaicenews/2010/08/a-most-interesting-arctic-summer/figure6-2/ |
Leave a Reply
You must be logged in to post a comment.