Category: General news

Managing director of Ebono Institute and major sponsor of The Generator, Geoff Ebbs, is running against Kevin Rudd in the seat of Griffith at the next Federal election. By the expression on their faces in this candid shot it looks like a pretty dull campaign. Read on

  • The Greenhouse Gas Emissions Profile of Coal Bed Methane (CBM) Production: A Review of Existing Research John Broderick, Maria Sharmina

    eScholar Services

    Supported by The University of Manchester Library

    The Greenhouse Gas Emissions Profile of Coal Bed Methane (CBM) Production: A Review of Existing Research

    John Broderick, Maria Sharmina

    Manchester: University of Manchester; 2014.

    Access to files

    Abstract

    This report offers an overview of greenhouse gas emissions profile of coal bed methane production from the existing academic and grey literature. It does not provide any new empirical evidence although additional calculations have been performed to allow for comparison between studies and with data for other sources of natural gas. Having examined the available literature, the report identifies where there are gaps that are relevant to UK development of CBM.

    Bibliographic metadata

    Type of resource:
    Content type:
    Publication date:
    Place of publication:
    Manchester
    Total pages:
    13
    Abstract:
    This report offers an overview of greenhouse gas emissions profile of coal bed methane production from the existing academic and grey literature. It does not provide any new empirical evidence although additional calculations have been performed to allow for comparison between studies and with data for other sources of natural gas. Having examined the available literature, the report identifies where there are gaps that are relevant to UK development of CBM.

    Record metadata

    Manchester eScholar ID:
    uk-ac-man-scw:225295
    Created by:
    Broderick, John
    Created:
    15th May, 2014, 12:50:32
    Last modified by:
    Broderick, John
    Last modified:
    20th August, 2014, 12:08:47
  • Warming waters threaten to trigger methane eruptions from Arctic Ocean seafloor

    Posts    FAQ    Myths    About    Contact    Tweets    Quotes    Videos    Links    Plan

    Saturday, August 30, 2014

    Warming waters threaten to trigger methane eruptions from Arctic Ocean seafloor

    K. Tung / Univ. of Washington. (Top) Global
    average surface temperatures, where black dots
    are yearly averages. Two flat periods (hiatus)
    are separated by rapid warming from 1976-1999.
    (Middle) Observations of heat content, compared
    to the average, in the north Atlantic Ocean.
    (Bottom) Salinity of the seawater in the same
    part of the Atlantic. Higher salinity is seen
    to coincide with more ocean heat storage.

    A new study looks at how, in the 21st century, surface warming slowed as more heat moved deeper into the oceans, specifically the North Atlantic.

    Sun-warmed salty water travels north along ocean currents in the Atlantic. When this saltier water reaches the North Atlantic, its greater density causes it to sink. From about 1999, this current began to speed up and draw heat deeper into the ocean.

    These huge amounts of heat moving deeper into the Atlantic Ocean are very worrying.

    The image below shows that sea surface temperatures have reached extremely high levels on the Northern Hemisphere, where sea surface temperature anomalies as high as 1.78 degrees Celsius were recorded on August 19, 2014.

    As discussed in an earlier post, water carried by the Gulf Stream below the surface can be even warmer than surface waters. As the post discusses, high sea surface temperatures west of Svalbard indicate that the Gulf Stream can carry very warm water (warmer than 16°C) at greater depths and is pushing this underneath the sea ice north of Svalbard. Similarly, warm water from greater depth comes to the surface where the Gulf Stream pushes it against the west coast of Novaya Zemlya.

    Very warm water is now invading the Arctic Ocean through the Bering Strait from the Pacific Ocean, while very warm water is also traveling on the back of the Gulf Stream from the North Atlantic into the Arctic Ocean.

    The danger is that this warm water will destabilize hydrates contained in sediments under the Arctic Ocean and trigger huge methane eruptions.

    Rising methane levels over the past few years are ominous in this respect. The image below shows very high mean global methane levels on August 28, 2014, while methane readings as high as 2561 ppb were recorded on that day.

    Methane Levels –  see earlier post for a discussion of IPCC/NOAA data

    In conclusion, the situation is dire and calls for comprehensive and effective action, as discussed at the Climate Plan blog.

    References and Related Links

    – Varying planetary heat sink led to global-warming slowdown and acceleration
    by Xianyao Chen and Ka-Kit Tung.
    http://www.sciencemag.org/content/345/6199/897

    – Cause of global warming hiatus found deep in the Atlantic Ocean
    University of Washington News Release
    http://www.washington.edu/news/2014/08/21/cause-of-global-warming-hiatus-found-deep-in-the-atlantic-ocean

    – Horrific Methane Eruptions in East Siberian Sea
    http://arctic-news.blogspot.com/2014/08/horrific-methane-eruptions-in-east-siberian-sea.html

    – Methane Buildup in the Atmosphere
    http://arctic-news.blogspot.com/2014/04/methane-buildup-in-atmosphere.html

    – Climate Plan blog
    http://climateplan.blogspot.com

  • Solar power storage solutions: Beyond batteries

    Solar Choice

    The development of affordable storage solutions for solar power or other renewable energy sources such as wind will change the nature of electricity generation and distribution as we know it. Most people think of wind and solar power storage (usually in the form of batteries) as a technology primarily for use in off-grid/stand-alone solar power systems. However, a growing number of companies are now offering increasingly intelligent solar power management and storage solutions–both for the residential and commercial solar power markets.

    Smart storage technologies for grid-connect and off-grid solar power

    The future of electricity generation is likely to veer away from the current model of centralised power production and distribution. Renewable energy technologies such as rooftop solar, which can be connected in a decentralised, ‘distributed’ way throughout the electrical grid, have the potential to transform the way we think about and generate power, with massive potential savings in store for homes, businesses, and electricity generation/transmission infrastructure as a whole.

    Battery banks: traditionally for off-grid solar power systems

    Traditionally, battery banks have been a technology only used primarily in solar power systems that are not connected to the electrical grid. The reason for this is fairly obvious: Off-grid homes need reliable power even at night, and solar panels are generally the most cost-effective way to generate it, but cannot provide on-demand power unless the sun is shining, which may not necessarily be when it is needed most. The solution is therefore to capture it in batteries which can then be drawn upon later to provide power.

    With grid-connected solar systems (which are these days by far the more numerous type), batteries are not necessary because the electricity grid functions as a kind of bottomless battery bank. Additionally, the cost of storage technology can be prohibitively high (although this is changing), making it quite unattractive for those who have the option to simply buy relatively cheap electricity from the grid. This dynamic is changing, however, with the price of retail electricity rising across Australia, and the price of solar PV systems also dropping rapidly.

    Why opt for power storage with a grid-connected solar PV system?

    It is helpful to think about a battery bank for an off-grid system as equivalent to the electricity grid for a grid-connect system. Due to the the individualised nature of battery banks (as well as the comparatively small scale of their industrial production), it is not yet possible for them to achieve the economies of scale that enable grid power to reach its relative level of affordability. This is why most households and businesses with grid-connect solar power systems don’t bother to install battery banks–when it’s more affordable to simply purchase power from the grid, why would anyone bother to opt for a storage system?

    Having a battery bank for a grid-connect system only makes sense if there is a way that the battery bank can be drawn on when it is advantageous for the system owner–usually during electricity peak rate periods of the day, when grid power is at its most expensive and the sun is not shining. Taking this factor into consideration creates a more complex dynamic than the traditional off-grid system, where the inverter-charger/system manager ordinarily needs only to ‘choose’ between solar power or the battery bank. In order to get the most out of a grid-connect system that also has an energy storage system (as distinguished from a simple battery bank for an off-grid system), however, the management software has to be ‘smarter’ and–ideally–programmable.

    Why programmable? Incentives for solar power generation differ from state to state in Australia, encouraging different patterns of electricity consumption timing. For example, if you have a grid-connected solar system in a state with a generous Solar Feed-in Tariff such as Queensland, it will make the most financial sense for you to export as much of your solar power as possible, whereas in a state with virtually no Solar Feed-in Tariff incentive (such as NSW), it makes more financial sense to self-consume as much as your solar power as possible, because allowing it onto the grid would be something of a ‘waste’. An intelligent, programmable storage system will give you the greatest amont of control over the use of the energy that you produce and store at home or in your business, allowing you to make sure that you’re using it in the most economically advantageous way possible.

    How do solar power storage solution technologies work?

    The number of solar power storage solution technologies available in Australia is limited but growing. Each one functions in a slightly different way, but the basic principle is the same: solar power can be collected in batteries for later use or to be fed into the grid, depending on the incentives. Solar power storage devices are generally comprised of a battery bank (utilising a technology such as standard-issue lead-acid or the increasingly affordable lithium-ion) and a smart inverter that can manage power in accordance with programming.

    The capacity of storage devices can vary by both the brand and the model of the product in question. It may even be the case that the ‘management’ portion of the technology is sold separately to the storage portion. Conventional battery banks for off-grid systems can basically be built and expanded to meet expected demand, and are managed by inverter-chargers. This can also be true of some grid-connect storage units, but generally speaking there is no reason to put together a system that will be able to supply a home or business with electricity for 3-5+ days, as may be required with an off-grid system. Instead, the surplus storage is used as a ‘buffer’ to protect the home or business from higher electricity prices, so in most cases enough storage capacity for 10-15 hours’ worth of power, depending on how it is used. Of course larger storage systems may also be used as power back-ups for systems in locations where grid reliability is shaky, or for institutions such as hospitals who need to remain fully operational even when the grid fails.

    Interestingly, grid-connect energy management/storage technologies need not necessarily even be attached to a distributed generation unit such as a solar PV system. Connection to the grid means that the grid can be used as a ‘generator’, and cheap, off-peak power can be used to charge up batteries and then consumed during peak periods when grid electricity is expensive. Where there is a Feed-in Tariff agreement in place, it would also be possible for a home or business to feed the stored electricity back into the grid and receive a premium payment for it–yet another opportunity to save money on electricity bills.

    What to look for in a grid-connect solar storage system

    While solar power systems are rated in kilowatts (kW), electricity storage capacity is measured in either ampere-hours (Ah, a measure commonly used in off-grid system battery banks) or kilowatt-hours (kWh, the same measure used in power bills to calculate electricity consumption as well as production). The level of storage capacity that you require will depend on how you plan to plan to use your power–simply as a back-up, or to maximise power bill savings? A useful way to look at the price of a storage unit is the price per kWh (as opposed to solar generation units, whose price is usually measured in cost per kilowatt).

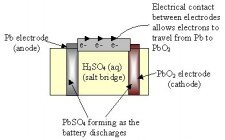
    The lifespan of the battery component of a solar storage/management technology is usually measured in ‘cycles’. Batteries used in storage systems are called ‘deep-cycle’ batteries, and can be routinely discharged to as low as a certain percentage of their capacity–e.g. 50% or 20% (as opposed to car batteries which need to stay closer to 100% in order to function properly). Essentially, a cycle is one round of completely discharging a fully charged battery, but in practice this is avoided as much as possible, because repeated discharges this ‘deep’ can shorten the lifespan of the battery, especially for the most common and affordable battery technology available: lead-acid batteries. The second most common type of battery commercially available is the lithium-ion battery, which can be discharged more deeply a greater number of times, but still remains significantly more expensive than lead-acid, although this is changing as technology improves, aided in great part by the global development of an electric vehicle market.

    In theory, storage systems should be able to utilise any type of electricity storage device that you can think of–including fuel cells. However, fuel cells have not reached the level of reliability or affordability that the two battery technologies mentioned above have. It may only be a matter of time, however, before fuel cells are worked into an off-the-shelf power storage solution. Similarly, it may also become possible for an electric vehicle to double as a power storage device, provided the system’s power management component is capable of operating it as such. (A company called Better Place has aimed to do just this.)

    What solar power storage technologies are commercially available in Australia?

    Power Router Diagram

    Power Router Diagram (Image via Nedap)

    One option available on the Australian market at the time of writing is the Netherland’s Nedap’s PowerRouter, whose modular nature allows for smart management of a small-scale renewable energy system as well as a battery bank if necessary.

    Another product soon to be available (from June 2012) is an Australian-made module from a prominent South Australian solar installation company.  This unit is unique for a number of reasons. It is a totally self-contained energy management and storage unit that extends battery life by ‘balancing’ them, drawing on batteries as individual units–as opposed to the conventional arrangement of a ‘bank’ of batteries strung together–and thus eliminating the ‘weakest link’ syndrome that battery banks are notoriously susceptible to.

    How distributed grid-connect power storage could change the nature of electricity generation, distribution, and renewable energy

    One of the main objections to the broad-scale uptake of renewable energy technologies is the issue of intermittency–solar technologies only produce power when the sun is shining, wind power only generates when the wind is blowing. This is in contrast to coal and gas generation (among others), which can be ramped up and down on demand. Although there have been a number of proposed fixes to the intermittency issue (such as highly detailed weather forecasting), widespread distributed storage could be a game-changing solution that few people could have seen coming even a few years ago. The idea is gaining traction internationally (below is a video of one new proposed technology that could change everything), and it may only be a matter of time before it becomes something that we all take for granted, like we all do our current generation infrastructure.

    Top image via Nedap

    © 2012 Solar Choice Pty Ltd

  • German report outlines vision for 100% renewable power

    German report outlines vision for 100% renewable power

    By on 26 August 2014
    Print Friendly

    Renewables International

    The results of a three-year project investigating what a purely renewable power supply would look like have been published. The findings could be a roadmap for the coming years bar unforeseen technical breakthroughs.

    wwf

    Source: WWF

    The visualization is nothing short of astonishing – see for yourself. And if you don’t speak German, you might want to use two screens, one with that website and one with this one because all I am going to do today is show you how to navigate the interactive graphics. In a future post, hopefully tomorrow, I will take a look at some of the underlying assumptions.

    Basically, we are looking at an hour-by-hour extrapolation of current data for a future scenario with a 100 percent renewable power supply. The project is called “combined power plant” (Kombikraftwerk), a sort of virtual power plant consisting of solar, wind, and biomass with ancillary storage & generation facilities, control technology, and power lines. We originally wrote about the project briefly last year.

    Back to the visualization – the map on the left shows you where what happens, and you click on the start button at the bottom left to go through the entire year hour by hour. If you press stop, you can also go through manually by hour (Stunde) or day (Tag), with vorherige(r) and nächste(r) meaning previous and next.

    At a rate of around two scenario hours per real-time second, it will take you more than an hour to view the entire year, so the bar at the bottom (scroll down if you can’t see it right away) is your friend. Use it to see, for instance, how solar pops up in the summer relative to wind in the winter.

    Over on the right, the chart shows the kind of flows in power production that my readers are used to seeing from Agora and thrown over data. Above the baseline, we have power production; below it, power consumption. The legends are as follows:

    Generation Consumption
    Excess Households
    Imports Industry
    Offshore wind Grid losses
    Onshore wind Power-to-gas
    Photovoltaics Batteries
    Bioenergy Pumped storage
    Biomethane Exports
    Batteries
    Pumped storage
    Green methane
    Hydropower
    Geothermal


    At the bottom, we see a legend with the two circles for the map chart. When more power is consumed locally, a blue circle appears, and there is even a breakdown of the power source: yellow indicates solar, blue wind power, green bioenergy, and white other. When more power is consumed in that particular area, the circle is red. The larger the circle, the more power is being generated/consumed. When the circle is especially red, a lot of power is being consumed without much being produced at that location.

    You will also notice some lines connecting the circles. They also expand and shrink, indicating the amount of electricity being transported – these are power lines. As the legend to the far bottom right shows (under “Leitungsbelastung” or line load), a black line indicates alternating current, whereas a gray line is direct current.

    Obviously, part of the investigation concerned what power lines would be needed. At various moments, large blue circles appear out in the water north of Germany, where wind farms are to be installed offshore. Likewise, we get a feel for how much is consumed and produced where in the country, though the hourly representation does not tell us what the average is over the year. To find bottlenecks, you would have to go in and check various locations on an hourly basis to see what steps need to be taken – a task probably best performance with the raw data, not this visualization.

    Drop me a comment below if you have any particular questions, and I will be back with a presentation of the background document, including the assumptions. Two things are already clear, however. First, it is useful to collect data in order to make such extrapolations for the future possible. And second, all of this is a purely technical feasibility discussion. It is quite possible that the amount of storage needed in this scenario, for instance, would make this particular arrangement unaffordable.

  • Home » 100% renewable » The affordability of 100 percent renewable power

    29.08.2014
    Font size
    1 Vote(s) Rating

    Scenarios

    The affordability of 100 percent renewable power

    The scenario we have described this week for a completely green power supply in Germany focuses on technical feasibility, mentioning the cost impact only in passing. Today, I share some of my thoughts about the affordability of the scenario and make a final call for questions I will post to the researchers next week.

    The study seems to have focused on electricity somewhat in isolation. In reality, electricity competes with other sources of energy on the heat and transport markets. The study assumes, however, that 612.4 TWh of power would be consumed in a year, as the legend shows at the top of the visualization – roughly the same amount as is consumed today. A discussion of the cost should, however, include electrification in other sectors. As mentioned on Wednesday, account is taken of electric mobility and heat pumps, but is that all?

    Denmark, for instance, plans to use excess renewable power to generate heat, which can be stored easily, and there is quite a bit of heat demand in Denmark. But the legend does not show anything that seems to resemble the storage of excess electricity as heat. Likewise, “batteries” could include electric vehicles, but it is questionable whether enough electric cars will necessarily be parked at a charging station when power from the grid needs to be stored. These cars might be on the road, for instance, or simply parked somewhere where they cannot be charged at that moment.

    What about electrification in industry – and while we are at it, isn’t there a lot of potential for demand response, particularly in industry?

     - This graphic shows power production (above the baseline) and consumption (below the baseline) for an entire year in the scenario, with storage included under "consumption." We end up with an incredible amount of "excess" (Überschuss) power at the top of the graph. Since power storage is included elsewhere, this electricity apparently goes unused. What percent exactly gets lost in this way, and is that acceptable?

    This graphic shows power production (above the baseline) and consumption (below the baseline) for an entire year in the scenario, with storage included under “consumption.” We end up with an incredible amount of “excess” (Überschuss) power at the top of the graph. Since power storage is included elsewhere, this electricity apparently goes unused. What percent exactly gets lost in this way, and is that acceptable?
    IWES

    Perhaps it is worth keeping in mind that Germany does not have a goal of 100 percent renewable power, but rather of 80 percent, with a 60 percent renewable energy target overall. Furthermore, it would hardly make sense to go 100 percent renewable for electricity without even addressing heat and transport.

    In this respect, the study is obviously a simplified investigation of the power sector in isolation. Given the obvious complexity, the simplification seems justified. But when we discuss financial feasibility, we should also keep in mind that the electrification of other sectors offers some affordable options.

    I will be back next week with some thoughts on the discussion in the comments about Germany getting six times more wind power from 10 percent fewer wind turbines, and I will also be speaking with the makers of the study to clear up a number of questions I have – see the list below. If you have a question you would like included, please use the comments box below, and I will consider adding it to the list.


    • Are the production and consumption data extrapolated from a previous year or years?
    • Why was the failure of the “largest power plant in Europe” assumed when no such plants would exist in Germany under a 100 percent renewable scheme?
    • What specific assumptions are made about electrification, such as in industry?
    • What do you mean by “solar arrays and wind turbines have faster reaction times” than 30 seconds in stabilizing the grid frequency?
    • How is dispatch coordinated? Is it still market-based?
    • What is the role of demand response?
    • What are the assumptions about power imports/exports?
    • How much electricity is lost as excess production?
  • The People’s March HANSEN

    AdSupply solar invertersungrowpower.com.au – High quality Sungrow solar inverters PV charger controller

    The People’s March

    Inbox
    x

    James Hansen via mail204.atl61.mcsv.net

    12:06 AM (9 hours ago)

    to me
    Email not displaying correctly? View it in your browser.
    The People’s March
    “The People’s March”, a discussion of why you should consider participating and why you need to understand what politicians are talking about or avoiding, is available here, from my web site, or our blog.

    ~Jim
    29 August 2014

    Like my Facebook page
    Like https://www.facebook.com/jimehansen on Facebook
    Share on social media
    Facebook Twitter
    Visit our program webpage
    http://csas.ei.columbia.edu/