Category: News

Add your news
You can add news from your networks or groups through the website by becoming an author. Simply register as a member of the Generator, and then email Giovanni asking to become an author. He will then work with you to integrate your content into the site as effectively as possible.
Listen to the Generator News online

 
The Generator news service publishes articles on sustainable development, agriculture and energy as well as observations on current affairs. The news service is used on the weekly radio show, The Generator, as well as by a number of monthly and quarterly magazines. A podcast of the Generator news is also available.
As well as Giovanni’s articles it picks up the most pertinent articles from a range of other news services. You can publish the news feed on your website using RSS, free of charge.
 

  • Jobs at risk from renewable energy target changes

    The full story…

    Jobs at risk from renewable energy target changes

    Matthew Doran reported this story on Saturday, August 23, 2014 08:17:54

    ELIZABETH JACKSON: A green energy analyst says any changes to the Renewable Energy Target, which is currently under Federal Government review, will affect far more than the environmental sector in Australia.

    It’s estimated that more than 20,000 people are employed in a variety of roles across the renewable industry sector, from construction to research and development.

    But the ongoing uncertainty is spooking a growing number of developers.

    From Adelaide, Matthew Doran reports.

    MATTHEW DORAN: Speculation surrounding the future of the Renewable Energy Target is making green developers across Australia nervous.

    This week Silex dumped plans to build a 100 megawatt solar plant at Mildura.

    Last month Pacific Hydro shelved $500 million of investment, including a 42-turbine wind farm north-east of Adelaide.

    Wasim Saman is a professor of sustainable energy engineering at the University of South Australia.

    He says the uncertainty is putting many jobs at risk.

    WASIM SAMAN: There are many hundreds of jobs which are now serving the sector and many businesses, particularly small businesses around the country which are installing systems.

    Some international companies are already talking about Australia deciding to put a halt on development in renewable, which is certainly not going to bring us more jobs and development in this country.

    KANE THORNTON: The industry today employs over 21,000 people and these people rely on the Renewable Energy Target. So if it was to be slashed then, you know, certainly a portion of those people would be looking at being unemployed.

    MATTHEW DORAN: Kane Thornton is the acting director of the Clean Energy Council.

    He says around 15 per cent of the nation’s power is now produced by renewable energy, but that will plateau if changes are made to the RET.

    KANE THORNTON: There are literally hundreds of really exciting renewable energy projects right around the country that are basically ready to go ahead, but they will only go ahead with the certainty about the future of the Renewable Energy Target.

    MATTHEW DORAN: Projects like the $1.5 billion, 197-turbine Ceres wind farm on South Australia’s Yorke Peninsula.

    South Australia already has half the nation’s wind turbines and Senvion Australia wants to build the largest wind farm in the country.

    The company’s managing director Chris Judd says many investors are uneasy about backing projects because they don’t know if they’ll be sound investments if the RET is reduced or scrapped.

    CHRIS JUDD: Either is devastating for the industry in terms of valuation of built renewable energy infrastructure, or the capacity to be able to finance and have a revenue stream that would warrant new capacity to be built.

    But we are of the view that sense will prevail; the data will be acknowledged and recognised and the interests of the people will be respected and the RET will remain untouched.

    ELIZABETH JACKSON: Senvion Australia’s Chris Judd ending that report from Matthew Doran in South Australia.

  • Dangerous climate change: Myths and reality (3)

    1 of 1
    AdCurrent CCM a Dead End?www8.hp.com/us/en/software/exstream – HP Extream CCM Delivers. Move Now and We Will Prove It.

    climate code red

    Inbox
    x

    Climate Code Red noreply@blogger.com via google.com

    6:23 PM (5 minutes ago)

    to me

    climate code red


    Dangerous climate change: Myths and reality (3)

    Posted: 23 Aug 2014 08:24 PM PDT

    Third in a 3-part series | Part 1 | Part 2

    by David Spratt

    Download report (16 pages)

    Myth 6: Long-term feedbacks are not materially relevant for carbon budgeting

    Some elements of the climate system respond quickly to temperature change, including the amount of water vapour in the air and hence level of cloud cover, sea-level changes due to ocean temperature change, and the extent of sea-ice that floats on the ocean in the polar regions. These changes amplify (increase) the temperature change and are known as short-term or “fast” feedbacks.

    There are also long-term or “slow” feedbacks, which generally take much longer (centuries to thousands of years) to occur. These include changes in large, polar, land-based ice sheets, changes in the carbon cycle (changed efficiency of carbon sinks such as permafrost and methane clathrate stores, as well as biosphere stores such as peat lands and forests), and changes in vegetation coverage and reflectivity (albedo).

    The IPCC’s 2013 assessment did not account for long-term feedbacks. Prof. Will Steffen (2013) notes that: “This budget may, in fact, be rather generous. Accounting for non-CO2 greenhouse gases, including the possible release of methane from melting permafrost and ocean sediments, or increasing the probability of meeting the 2°C target all imply a substantially lower carbon budget”. The question is whether these feedbacks are materially relevant for this century’s time-scale, and the evidence is in the affirmative.

    Take one example, that of Arctic carbon stores:

    • As discussed above, permafrost and methane clathrate stores are already being mobilised, though the scale is not yet large. However a UNEP report (2012) on “Policy implications of warming permafrost” says the recent observations “indicate that large-scale thawing of permafrost may have already started.” And Schaefer, Zhang et al. (2011) found that: “The thaw and release of carbon currently frozen in permafrost will increase atmospheric CO2 concentrations and amplify surface warming to initiate a positive permafrost carbon feedback (PCF) on climate…. [Our] estimate may be low because it does not account for amplified surface warming due to the PCF itself….  We predict that the PCF will change the Arctic from a carbon sink to a source after the mid-2020s and is strong enough to cancel 42-88% of the total global land sink. The thaw and decay of permafrost carbon is irreversible and accounting for the PCF will require larger reductions in fossil fuel emissions to reach a target atmospheric CO2 concentration” (emphasis added).
    • Paleoclimatology (study of past climates) suggests that if longer-term feedbacks are taken into account, then the Earth’s sensitivity to a doubling of CO2 could itself be up to double that of the “fast” climate sensitivity used by most climate models, in the range 4.5–6°C (The Geological Society, 2013). These “slow” feedbacks amplify the initial warming burst. A measure of these effects for a doubling of CO2 is known as Earth System Sensitivity (ESS). Longer-term ESS is generally considered to come into play over periods from centuries to several millennia, depending on how fast is the rate of change in greenhouse gas levels and temperature. The problem is that the rate of climate change now being driven by human actions may be as fast as any extended warming period over the past 65 million years, and it is projected to accelerate in the coming decades. This means that longer-term “slow” events associated with ESS – such as loss of large ice sheets, and changes in Arctic and biosphere carbon stores – are starting to occur now, are happening much more quickly than expected, and likely will proceed at a significant scale in the current century. We face an event unprecedented in the last 65 million years of “fast” short-term and “slow” long-term climate sensitivity events occurring alongside one another in parallel, rather than one after the other in series as is usually the case. Thus, even as some of the “fast” warming is still to occur, some of the “slow” feedbacks are already coming into play, as is now evident (Previdi, Liepert et al., 2011; Hansen, 2013).

    Myth 7: There is time for an orderly, non-disruptive reduction in emissions within the current political-economic paradigm

    Advocates for climate change action often emphasise the positive economic consequences, such as a boom in “green” jobs, the clean energy industrial revolution, or the great investment opportunities.

    But there is another economic component to the discourse. It is the view that actions should not be undertaken that would be economically disruptive, and therefore the range of actions to be considered should only be those which do not challenge overall economic growth.

    The unfortunate consequence of this framing is that actions that are necessary are not advocated, as was demonstrated in their respective reports to the UK and Australian governments by Sir Nicholas Stern and Prof. Ross Garnaut.

    Stern (2006) said keeping the rise to 2°C was “already nearly out of reach” because it meant emissions “peaking in the next five years or so and dropping fast”, which he judged to be neither politically likely nor economically desirable. He said that annual emission reductions of more than one per cent a year “have historically been associated only with economic recession or upheaval”, and that it would be “very difficult and costly to aim to stabilise at 450ppm CO2e” (viewed as a 2°C target). So he nodded towards a higher target where “the annual costs of achieving stabilisation between 500 and 550ppm CO2e are around 1% of global GDP” because “stabilisation of greenhouse gas concentration in the atmosphere is feasible and consistent with continued growth”.

    Likewise, Garnaut was drawn to the politically pragmatic in his work. Whilst it was clear by the end of 2007 that 450 ppm was far from a safe or reasonable target, the Review did not heed strong calls from advocates to model and consider a safer 350 ppm scenario and, like Stern, it stuck to the 450 and 550 ppm targets. And whilst describing the action necessary for Australia to play a reasonable part in holding to 450ppm, Garnaut then suggested that as interim measure, pending global agreement, that Australia should act only for the 550ppm target.

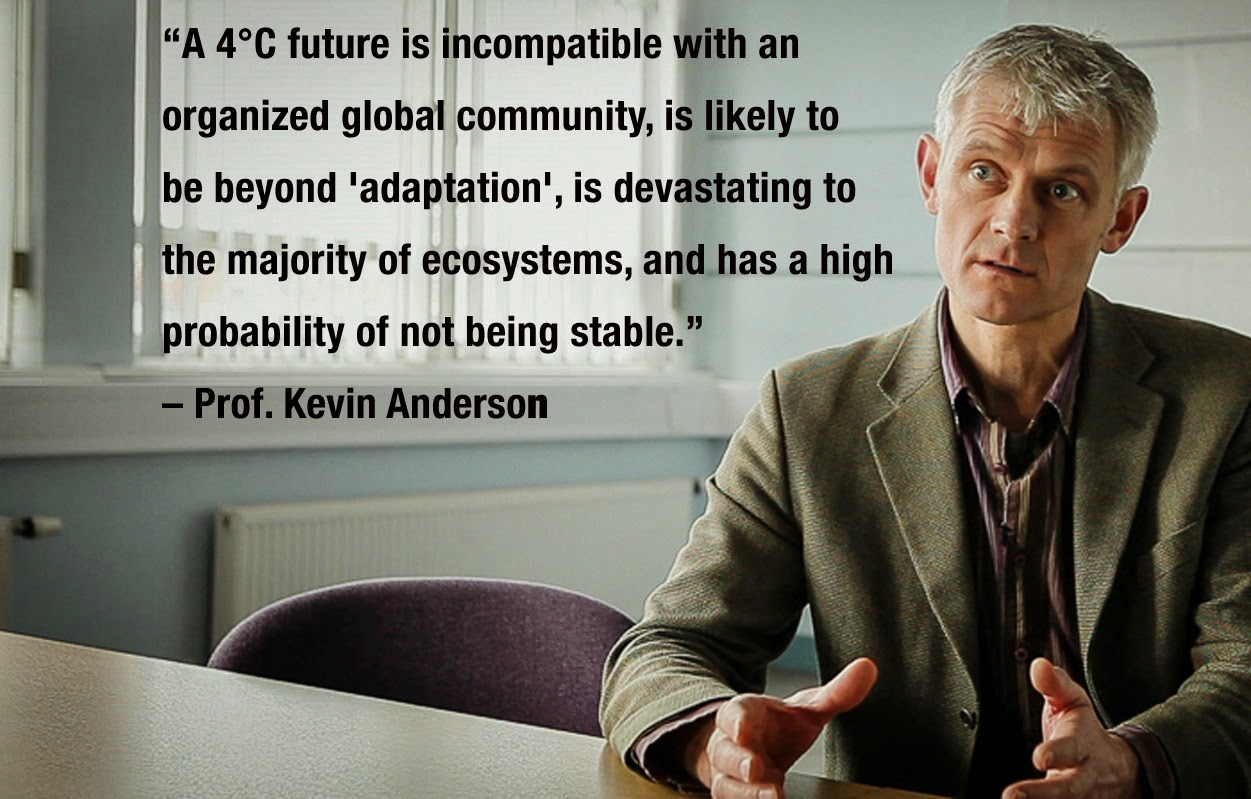
    Prof. Kevin Anderson notes that:

    Reductions in emissions greater than 3-4 per cent per annum are incompatible with a growing economy (or so we’re repeatedly advised). From Stern and the UK’s Committee on Climate Change through to virtually every 2°C emission scenario developed by ‘Integrated Assessment Modellers’, reductions in absolute emissions greater than three to four per cent year on year are judged incompatible with a growing economy… we have found no examples of economists suggesting that prolonged emission-reductions above three to four per cent per annum are economically sustainable (Anderson, 2013).

    Whether fast rates of de-carbonisation are incompatible with a growing economy is not established, because they may be possible in a highly-regulated economy, even if not in the deregulated economies about which Stern and Garnaut were writing. But the practical consequence is that few advocates want to push high de-carbonisation rates because of the perception of negative economic consequences.

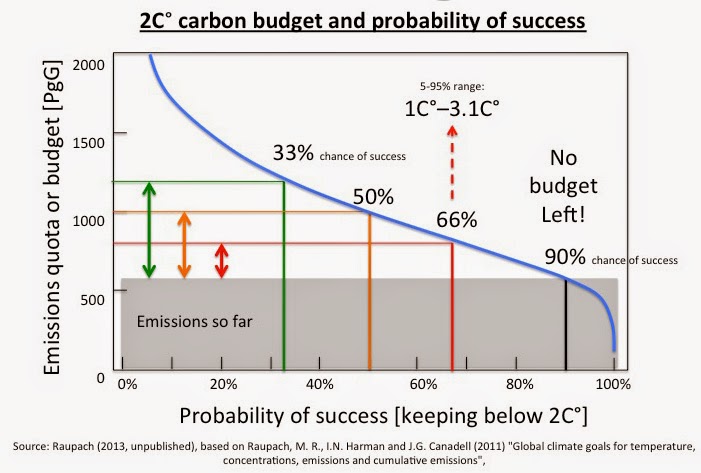
    For industrialised nations with high per capita emissions, adhering to the 2°C target (even with high risks of failure) requires emissions reductions of round ten per cent a year. See Figure 4. But very few participants in climate policy-making are prepared to even whisper about such a scale of action, less they be considered economic vandals.

    Anderson and Bows (2012) conclude that:

    …academics may again have contributed to a misguided belief that commitments to avoid warming of 2°C can still be realized with incremental adjustments to economic incentives. A carbon tax here, a little emissions trading there and the odd voluntary agreement thrown in for good measure will not be sufficient… as the remaining cumulative budget is consumed, so any contextual interpretation of the science demonstrates that the threshold of 2°C is no longer viable, at least within orthodox political and economic constraints… Acknowledging the immediacy and rate of emission reductions necessary to meet international commitments on 2 °C illustrates the scale of the discontinuity between the science (physical and social) underpinning climate change and the economic hegemony. Put bluntly, climate change commitments are incompatible with short- to medium-term economic growth (in other words, for 10 to 20 years). Moreover, work on adapting to climate change suggests that economic growth cannot be reconciled with the breadth and rate of impacts as the temperature rises towards 4°C and beyond 6°C — a serious possibility if global apathy over stringent mitigation persists. Away from the microphone and despite claims of ‘green growth’, few if any scientists working on climate change would disagree with the broad thrust of this candid conclusion. The elephant in the room sits undisturbed while collective acquiescence and cognitive dissonance trample all who dare to ask difficult questions.

    Todd Stern, the U.S. Special Envoy for Climate Change contrasts the 2°C target with “the art of the possible”:

    For many countries, the core assumption about how to address climate change is that you negotiate a treaty with binding emission targets stringent enough to meet a stipulated global goal — namely, holding the increase in global average temperature to less than 2°C above pre-industrial levels — and that treaty in turn drives national action. This is a kind of unified field theory of solving climate change: get the treaty right; the treaty dictates national action; and the problem gets solved. This is entirely logical. It makes perfect sense on paper. The trouble is it ignores the classic lesson that politics — including international politics — is the art of the possible (Rigg, 2012).

    And the bottom line is that the “art of the possible” means one thing above all other: no economic disruption.

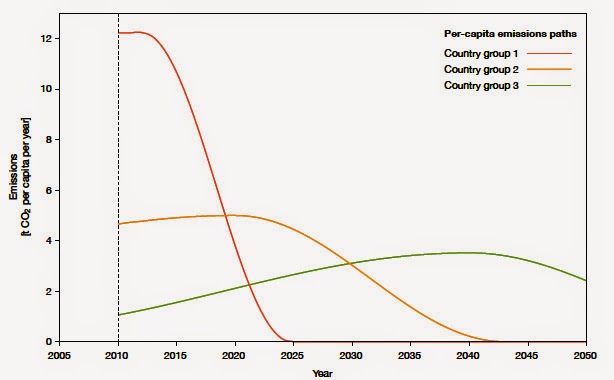
    Figure 4: Emissions reduction paths for 2°C target (66% probablity). Examples of per-capita emissions paths of CO2 for three groups of countries according to the WBGU budget approach without emissions trading. Although they allow compliance with national budgets, they would only be partly practicable in reality. The countries are grouped according to their annual CO2 emissions per capita from fossil sources, whereby the CO2 emissions are estimates for 2008 and the population figures are estimates for 2010. Red: Country group 1 (greater than 5.4 t CO2 per capita per year), mainly industrialised countries, (e.g. EU, USA, Japan) but also oil-exporting countries (e.g. Saudi-Arabia, Kuwait, Venezuela) and some newly industrializing countries (e.g. South Africa, Malaysia). Orange: Country group 2 (2.7–5.4 t CO2 per capita per year), which includes many newly industrializing countries (e.g. China, Mexico, Thailand). Green: Country group 3 (less than 2.7 t CO2 per capita per year), mainly developing countries (e.g. Burkina Faso, Vietnam) but also large newly industrializing countries (e.g. India, Brazil). Source: WBGU, 2009.

    Conclusion

    The stated purpose of international climate negotiations is to avoid “dangerous” climate change or, more formally, to prevent “dangerous anthropogenic interference with the climate system”. But if conditions existing today are already sufficient to push more climate system elements past their tipping points and create “catastrophic” breakdown without any further emissions, what then is our purpose and what do we say?

    The following seems consistent with the research surveyed above:

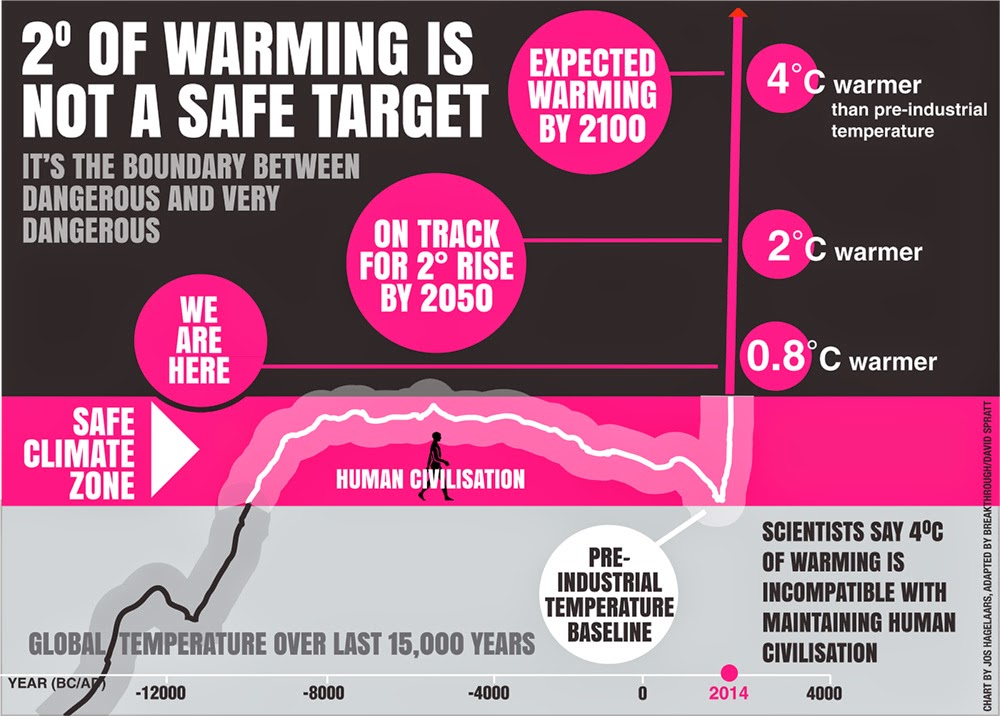
    • At just 0.8°C of warming and with temperatures just above the Holocene zone, climate change is already dangerous with tipping points passed for significant earth system elements, including West Antarctic glaciers and summer Arctic sea-ice. The last time greenhouse gases were this high, temperatures were 3+°C degrees higher, and sea levels 25-40 metres higher.
    • 2°C of warming is the boundary between dangerous and very dangerous climate change, and the non-dangerous (safe) zone is well under 1°C and in the Holocene range, yet the present level of greenhouse gases is sufficient to produce more than 2°C of warming.
    • We have already gone too high with greenhouse emissions, and practically speaking there is no carbon budget available for burning more fossil fuels for the 2°C target, and no carbon budget available if catastrophic risk management methods (low rates of failure) are applied.
    • Australia is just 0.3% of the world’s population but counts for 1.5% of emissions, five times the global average, and one of the world’s highest per capita emitters. Taking the IPCC’s too optimistic carbon budget at face value, and allowing equal global per capita emissions, Australia’s carbon budget for 2°C runs out in six years.
    • To minimise climate change damage and avoid reaching 2°C — by which time many significant tipping points and carbon cycle feedbacks will likely have been triggered — it is necessary for a global emergency response which aims to de-carbonise as fast as humanly possible, plus build large carbon drawdown capacity, to try and keep warming below 1.5°C and then return to the Holocene zone.

    Many participants in global discussions and debates say such a scale of action is not possible in a non-disruptive manner within the current political-economic frame.  If this is the case, we face a choice of challenging this frame, or accepting that we must fail in our goal.

    Whether or not there is yet the political power or support for actions consistent with the science, it is important that they be articulated so that understanding and support for them can grow. As just one example, Anderson (2014) outlines a radical emissions reduction plan:

    In essence a 2°C energy agenda requires rapid and deep reductions in energy demand, beginning immediately and continuing for at least two decades. This lengthens the window of opportunity in which to transition to a low carbon energy supply system (almost zero-carbon for 2°C). Nevertheless, and counter to most low-carbon scenarios, if poorer nations are to be ‘given’ a longer period for de-carbonisation, a genuinely 2°C energy supply system for the majority of Annex 1 nations would need to be virtually zero-carbon by around 2030; in effect a Marshall plan for energy supply.

    Such immediate cuts in energy demand will require around two decades of revolutionary reductions in energy consumption from high-energy users, and a substantial, but evolutionary, reduction from those with more moderate consumption habits.

    My headline (and very provisional) framing for the UK, or similar Annex 1 nation, would include a suite of regulatory measures, buttressed where necessary with price mechanisms. In addition it would be important to understand the role of behaviours and practices both in helping frame effective legislation, but also in fostering a deeper civic and institutional engagement with the low-carbon agenda. At the risk of being either shot down for absence of detail or deliberately quoted out of context, a provisional and partial list of low-carbon regulations offers a flavour of what such an iterative de-carbonisation agenda may include:

    • Strict energy/emission standards for appliances with a clear long-term market signal of the amount by which the standards would annually tighten; e.g. 100gCO2/km for all new cars commencing 2015 and reducing at 10% each year through to 2030
    • Strict energy supply standards; e.g. for electricity 350gCO2/kWh as the mean emissions level of a suppliers’ portfolio of power stations; tightened at ~10% p.a.
    • A programme of rolling out stringent energy/emission standards for industry equipment
    • Stringent minimum efficiency standards for all properties for sale or rent
    • World leading low-energy standards for all new-build houses, offices etc.
    • Moratorium on airport expansion
    • Technological and operational standards for shipping operating in UK waters
    • A suite of iterative mechanisms to counter, or at least alleviate, issues of rebound, this may include price mechanisms, progressive metering tariffs, etc.
    • Revisit the viability of Personal Carbon Trading as a mechanism for improving societal engagement in non-marginal change
    • Appoint a senior minister with the principal responsibility for maintaining an equitable transition to a low-carbon society.

    Anderson says that such a proposal “will be dismissed by many as naïve or impossible – but to some extent dismissals should be taken as recommendations for this agenda; at least for a 2°C future. The political and economic hegemony has procrastinated for too long for it to be able to deliver on its own 2°C promises (on its own terms).”

    Note: References available at PDF download

  • Dangerous climate change: Myths and reality (2)

    5 of 7
    AdCurrent CCM a Dead End?www8.hp.com/us/en/software/exstream – HP Extream CCM Delivers. Move Now and We Will Prove It.

    climate code red

    Inbox
    x

    Climate Code Red noreply@blogger.com via google.com

    6:11 PM (17 minutes ago)

    to me

    climate code red


    Dangerous climate change: Myths and reality (2)

    Posted: 22 Aug 2014 07:29 PM PDT

    Part 2 in a 3-part series | Part 1 | Part 3

    by David Spratt

    Download report (16 pages)

    Myth 3: Big tipping points are unlikely before 2°C

    Tipping points, often an expression of non-linear events, are difficult to project. But if it is sometimes hard to see tipping points coming, it is also too late to be wise after the fact. Estimated tipping points around or below ~1.5ºC include: 

    • West Antarctic Ice Sheet: Current conditions affecting the West Antarctic Ice Sheet are sufficient to drive between 1.2 and 4 metres of sea rise, and these glaciers are now in “unstoppable” meltdown at global average warming of just 0.8ºC (NASA, 2014A; Rignot, Mouginot et al., 2014; Joughin, Smith et al., 2014). 

    • Loss of summer Arctic sea-ice: Because climate models generally have been poor at dealing with Arctic sea-ice retreat (see summary of literature at Spratt, 2013), expert elicitations play a key role in considering whether the Arctic has passed a very significant and “dangerous” tipping point, including Steffen (quoted by Cubby, 2012), Livinia and Lenton (2013), UWA (2012), Serreze (quoted by Romm, 2012), Wadhams (2012, and quoted by Vidal, 2012), Maslowski, Kinney et al. (2012) and Laxton (quoted by McKie, 2012). Duarte, Lenton et al. (2012) find that: “Warming of the Arctic region is proceeding at three times the global average, and a new ‘Arctic rapid change’ climate pattern has been observed in the past decade.” Reductions in the sea-ice cover are believed to be the largest contributor toward Arctic amplification. Maslowski, Kinney et al. (2012) note that: “a warming Arctic climate appears to affect the rate of melt of the Greenland ice sheet, Northern Hemisphere permafrost sea-level rise, and global climate change”. It is worth noting that one month of sea-ice-free summer conditions in the Arctic each year would add approx. 0.2°C to global warming (Hudson, 2011), an event that though credible in the next few decades is not taken into account in any carbon budget modelling. 
    • Greenland Ice Sheet (GIS): Current-generation climate models are not yet all that helpful on GIS. They have a poor understanding of the processes involved, and acceleration, retreat and thinning of outlet glaciers are not represented (Maslowski, Kinney et al., 2012). Estimated tipping point for GIS is +1.6ºC with an uncertainty range of +0.8 to +3.2ºC (Robinson, Calov et al., 2012). A recent study finds that deep canyons will contribute to more rapid GIS deglaciation (NASA, 2014B; Morlighem, Rignot et al., 2014). Contrary to previous studies, that estimated it would take centuries to millennia for new climates to increase the temperature deep within ice sheets such as GIS, the influence of melt water means warming can occur within decades and produce rapid accelerations (Phillips, Rajaram et al., 2013; University of Colorado Boulder, 2013). As well, “rapid iceberg discharge is possible in regions where highly crevassed glaciers are grounded deep beneath sea level, indicating portions of Greenland and Antarctica that may be vulnerable to rapid ice loss through catastrophic disintegration” (Basis and Jacobs 2013). Informally, many leading cryosphere scientists say the GIS has passed its tipping point, “is already lost” and similar sentiments (pers. com.). With Arctic amplification of around three times average global warming, it is hard to conceive that GIS deglaciation will other than continue to accelerate as reflectivity declines, and late-summer ocean conditions become ice-free. In 2012, then NASA climate science chief James Hansen told Bloomberg that: “Our greatest concern is that loss of Arctic sea ice creates a grave threat of passing two other tipping points – the potential instability of the Greenland ice sheet and methane hydrates… These latter two tipping points would have consequences that are practically irreversible on time scales of relevance to humanity” (Morales, 2012).  
    • Coral reefs: “Preserving more than 10 per cent of coral reefs worldwide would require limiting warming to below +1.5°C (atmosphere–ocean general circulation models (AOGCMs) range: 1.3–1.8°C) relative to pre-industrial levels” (Frieler, Meinshausen et al., 2013). At 10 per cent, the reefs would be remnant, and the ecosystems as we know them today would be a historical footnote. Data suggests the area of reef systems has already been reduced by half around the world.  
    • Permafrost:  In February 2013, scientists using radiometric dating techniques on Russian cave formations to measure melting rates warned that a 1.5ºC global rise in temperature compared to pre-industrial was enough to start a general permafrost melt. Vaks, Gutareva et al. (2013) found that “global climates only slightly warmer than today are sufficient to thaw extensive regions of permafrost.” Vaks says that: “1.5ºC appears to be something of a tipping point”. In May 2013, Brigham-Grette, Melles et al., (2013) published evidence from Lake El’gygytgyn, in north-east Arctic Russia, showing that 3.6–3.4 million years ago, summer mid-Pliocene temperatures locally were ~8°C warmer than today, when CO2 was ~400 ppm (a similar level to today). This is highly significant because researchers say the tipping point for large-scale permafrost carbon loss is around +8ºC to 10ºC regional temperature increase (Bitz, Ridley et al, 2009). As well, research from Ballantyne, Axford et al. (2013) finds that during the Pliocene epoch, when CO2 levels were ~400 ppm, Arctic surface temperatures were 15-20°C warmer than today’s surface temperatures. Soon to be published work by Shakhova and Semiletov, as a follow-up to their 2013 paper on shallow-water, sea-floor sediment cores on the East Siberian Arctic Shelf, finds the ocean floor permafrost layer at “thaw point” temperature and “slushy” (pers. com.), suggesting vulnerability of the underlying methane hydrate stability zone, in the area where vast new methane plumes in the ocean are being observed in the 2014 northern summer (Papadopoulou, 2014).
    Figure 2: 2°C of warming is not a safe target. The temperature reconstruction of Shakun, Clark et al. (2012) and Marcott, Shakun et al. (2013) is combined with the instrumental period data from HadCRUT4 and model average of IPCC projections for the A1B scenario up to 2100.

    In summary, there is a very high risk that further significant tipping points will be passed before warming reaches 2°C. Some of these are irreversible on time scales of centuries to a millenia.

    Myth 4: We should mitigate for 2°C, but plan to adapt to 4°C

    The failure of international climate negotiations and insufficient national efforts have led many negotiators and commentators to conclude that warming will not be held to 2ºC and much higher warming is likely. This has resulted in a policy approach of still trying to reduce emissions (mitigate) for 2ºC, whilst also planning to adapt to 4ºC of warming.

    World Bank (2012) and Price Waterhouse Coopers (2012) reports complement a range of research that suggests the world is presently heading for 4ºC or more of warming this century. Global average warming of 4ºC means around 6°C of warming over land, and perhaps 7–8°C at the extremes. IEA Chief Economist Fatih Birol says that emission trends are “perfectly in line with a temperature increase of 6°C, which would have devastating consequences for the planet” (Rose, 2012).

    The notion that we can reasonably adapt to 4°C is ill-founded because:

    • Climate researcher Rachel Warren says that: “In… a 4°C world, the limits for human adaptation are likely to be exceeded in many parts of the world, while the limits for adaptation for natural systems would largely be exceeded throughout the world. Hence, the ecosystem services upon which human livelihoods depend would not be preserved. Even though some studies have suggested that adaptation in some areas might still be feasible for human systems, such assessments have generally not taken into account lost ecosystem services” (Warren, 2010).
    • Professor Neil Adger says: “Thinking through the implications of 4°C of warming shows that the impacts are so significant that the only real adaptation strategy is to avoid that at all cost because of the pain and suffering that is going to cost… There is no science on how we are going to adapt to 4°C warming. It is actually pretty alarming” (Randerson, 2008).
    • At 4°C hotter, the world would be warmer than during any part of the period in which modern humans evolved, and the rate of climate change would be faster than any previously experienced by humans. The world’s sixth mass extinction would be in full swing. In the oceans, acidification would have rendered many calcium-shelled organisms such as coral and many at the base of the ocean food chain artifacts of history. Ocean ecosystems and food chains would collapse (literature surveyed by Spratt, 2011).
    • Warming of 4ºC is sufficient to melt the polar ice sheets and produce 70 metres of sea-level rise over a longer period of time (Hansen, Sato et al., 2013).
    • Prof. Kevin Anderson (2011) says there is a widespread view amongst scientists that “a 4°C future is incompatible with an organised global community, is likely to be beyond ‘adaptation’, is devastating to the majority of ecosystems and has a high probability of not being stable”.

    One question remains: if the world has practically speaking given up on holding to 2°C and it is not possible for human civilization to survive in a 4°C warmer world, what’s the plan? Some have suggested that in fact we have a substantial “carbon budget” available for the 2°C target…

    Myth 5: We have a substantial carbon budget left for 2°C

    The carbon budget has come to public prominence in recent years, including in the IPCC’s Fifth Assessment Report in 2013, as being the difference between the total allowable greenhouse gas emissions for 2°C of warming, and the amount already emitted or spent.
    But this is not as simple as it seems, because 2°C means different things to different people:

    • The 2°C cap: A cap is an upper boundary, not to be exceeded. This is implicit in international agreements such as the Copenhagen Accord and Cancun Agreements which aim to “hold the increase in global average temperature below 2°C, and to take action to meet this objective consistent with science and on the basis of equity” and the position of the European Commission in 2007, to “ensure that global average temperatures do not exceed preindustrial levels by more than 2°C” and to “adopt the necessary domestic measures… to ensure” this is the case (emphasis added). This language implies a very low probability of exceeding the target. This is consistent with the approach taken in catastrophic risk management, where the risk of failure must be very small (Dunlop, 2011). Climate change with its non-linear events, tipping points and irreversible events – such as mass extinctions, destruction of ecosystems, the loss of large ice sheets and the triggering of large-scale releases of greenhouse gases from carbon stores such as permafrost and methane clathrates – contains many possibilities for catastrophic failure.
    • The 2°C target: A target can be overshot; in common parlance, we may “miss the target”. This is the language employed for the carbon budget, where misses are part of the target calculations. The IPCC gives carbon budgets only for 33%, 50% and 66% chances of keeping to 2°C (IPCC, 2013).  Higher probabilities of achieving the target were not reported. The most stringent — at 66% — has a one-in-three chance of exceeding the target, and a range of outcomes from 1°C to 3.1°C (with 95% confidence).
    Figure 3: The carbon budget and probability of success. The budget (vertical axis) is related to risk of failure (overshooting 
the 2°C) (horizontal axis) along the blue curve.  Emissions to date are indicated by grey box, leaving the available budget as 
the distance between the blue curve and grey box. As chance of not exceeding the target increases from 33% (green) to 50% (orange) to 66% (red), the budget decreases. At 90% chance of not exceeding the target (black), no carbon budget remains.

    With this distinction between “cap” and “target” in mind:

    • For the 2°C cap, and a risk-averse (low probability of less than 10%) approach of not exceeding the target, there is no carbon budget left for the 2°C target: “…the combination of a 2°C warming target with high probability of success is now unreachable” using the current suite of policy measures, because the budget has expired (Raupach, Harman et al., 2011; Raupach, 2013). See Figure 3. “[T]o provide a 93 per cent mid-value probability of not exceeding 2°C, the concentration would need to be stabilized at, or below, 350 ppmv CO2e, i.e. below current levels”  (Anderson and Bows, 2008).If some reasonably optimistic assumptions are made about deforestation and food-related emissions (halving per unit of production) for the rest of the century, then most emission reduction scenarios are incompatible with holding warming to 2°C, even with a high 50% probability of exceeding the target, and there is no budget left for fossil fuel emissions  (Anderson and Bows, 2008).
    • If we make some optimistic assumptions about how soon emissions peak and decline in the developing world (non-Annex 1 nations), there is no carbon budget available for developed nations (Annex 1 countries) (Anderson and Bows, 2011).
    • Accounting for the possible release of methane from melting permafrost and ocean sediment implies a substantially lower budget, but this was not done (IPCC 2013).

    The idea of a carbon budget and “allowable” emissions is dangerous, according to climate scientist Ken Caldeira:

    There are no such things as an ‘allowable carbon dioxide (CO2) emissions’. There are only ‘damaging CO2 emissions’ or ‘dangerous CO2 emissions’. Every CO2 emission causes additional damage and creates additional risk. Causing additional damage and creating additional risk with our CO2 emissions should not be allowed. If you look at how our politicians operate, if you tell them you have a budget of XYZ, they will spend XYZ. Politicians will reason: ‘If we’re not over budget, what’s to stop us to spending? Let the guys down the road deal with it when the budget has been exceeded.’ The CO2 emissions budget framing is a recipe for delaying concrete action now. (Caldeira, quoted by Romm, 2013B)

    Finally, we need to remember that the current level of greenhouse gases is already enough for more than 2°C of warming, though some gases such as methane are relatively short-lived in the atmosphere. Ramanthan and Feng (2008) calculated that the observed increase in the concentration of greenhouse gases (GHGs) since the pre-industrial era has most likely committed the world to a warming of 2.4°C (within a range of +1.4°C to +4.3°C) above the pre-industrial surface temperatures.

    Note: References available at PDF download

  • Polar melt confirmed from space

    Ice-Blog

    Climate Change in the Arctic & around the globe

    Polar melt confirmed from space

    Greenland ice wall

    The Greenland ice sheet, photographed 2009 (I.Quaile)

    I am disappointed that there was so little mainstream media coverage (please correct me if I am wrong) of a report from a team of scientists from Germany’s Alfred Wegener Institute (AWI) in Bremerhaven who have analysed just over two years of data from the CryoSat-2 satellite. Their conclusion that the Greenland ice sheet and Antarctica’s glaciers are melting at record pace, dumping some 500 cubic kilometers of ice into the oceans every year, twice as much in the case of Greenland and three times as much in the case of Antarctica, by comparison with 2009 – yes, you read right, we are talking about a very short period for such a dramatic increase in ice loss – should have made more news headlines and not just the science pages.

    To understand the scale of that, the researchers say it would be the equivalent of an ice sheet that’s 600 meters thick and covers an area as big as the German city of Hamburg – or, my colleagues here at DW calculate, as big as Singapore.

    The research team headed by Veit Helm used around two years’ worth of data from the ESA CryoSat-2  satellite to create digital elevation models of Greenland and Antarctica. The results were published in the online magazine of the European Geoscience Union (EGU)  The Cryosphere.

    “The new elevation maps are snapshots of the current state of the ice sheets,” Helm says. “The elevations are very accurate, to just a few meters in height, and cover close to 16 million square kilometers of the area of the ice sheets.” He says this includes an additional 500,000 square kilometers that weren’t covered in previous elevation models from altimetry.

    infografik ice engl

    Space technology shows declining ice mass

    Helm and his team analyzed all data from the CryoSat-2 radar altimeter SIRAL in order to come up with the detailed maps. The satellite with this new radar equipment was launched in 2010. Satellite altimeters measure the height of an ice sheet by sending radar or laser pulses which are then reflected by the surface of the glaciers or surrounding areas of water and recorded by the satellite.

    The researchers used other satellite data as well to document how elevation has changed between 2011 and 2014.

    Rapid ice loss over a short period of time

    The team used more than 200 million SIRAL data points for Antarctica and some 14 million data points for Greenland to create the elevation maps. The results show that Greenland alone is losing around 375 cubic kilometers of ice per year.

    Compared to data which was collected in 2009, the loss of mass from the Greenland ice sheet has doubled. The rate of ice discharge from the West Antarctic ice sheet tripled during the same period.

    I think this is definitely worth talking about. We know the huge implications of polar ice melt for global sea levels. Other research from this year also tells us that, at least in the case of parts of Antarctica, the ice melt is probably irreversible.

    We cannot afford to ignore what is happening to the ice sheets. The extent of ice loss in Greenland is particularly dramatic. I am losing patience with those people who respond to studies like this and our reporting on it by saying “but the East Antarctic is gaining volume” and “the Antarctic sea ice has grown”. It is so easy to take things out of context and mix different factors up when trying to understand a very complex system.

    I will give the last word here to AWI glaciologist Angelika Humbert, who co-authored the study:  ”If you combine the two ice sheets (Greenland and Antarctic), they are thinning at a rate of 500 cubic kilometers per year. That is the highest rate observed since altimetry satellite records began about 20 years ago.” It seems to me there is no arguing with that.

    Related stories:

    Antarctic melt could raise sea levels faster 

    West Antarctic ice sheet collapse unstoppable

    Climate change risk to icy East Antarctica

    Antarctic Glacier’s retreat unstoppable

  • Scientists Create Thin, Transparent Solar Generator

    Scientists Create Thin, Transparent Solar Generator

    By Andy Tully | Thu, 21 August 2014 23:14 | 0

    Benefit From the Latest Energy Trends and Investment Opportunities before the mainstream media and investing public are aware they even exist. The Free Oilprice.com Energy Intelligence Report gives you this and much more. Click here to find out more.

    Not many people think clunky solar roof panels are attractive, but we live with the unsightly installations because they provide clean, renewable energy.

    It would be better if solar power could be generated by nearly invisible means – say a thin, transparent film that lays on the screen of your cell phone or over the windows of your house.

    Select the reports you are interested in:

    NO-SPAM: Under no circumstances will we EVER rent, sell or give away your email

    That’s what a team of researchers at Michigan State University has developed, and the name they came up with sounds like something out of Star Trek: “Transparent luminescent solar concentrator.”

    MSU’s Richard Lunt says the key word is “transparent” because previous attempts to make such a panel work have resulted in weak energy production and, worse, the need for a highly colored panel.

    “No one wants to sit behind colored glass,” says Lunt, an assistant professor of chemical engineering and materials science. “It makes for a very colorful environment, like working in a disco. We take an approach where we actually make the luminescent active layer itself transparent.”

    In an article in the journal Advanced Optical Materials, Lunt and his team reported developing small organic molecules in clear plastic panels that are used to absorb specific, nonvisible wavelengths of sunlight. He said these materials then react with only near-infrared and ultraviolet wavelengths, which then glow at yet another invisible wavelength within the infrared.

    Next, this glowing infrared light is guided to the edge of the plastic panel where thin strips of photovoltaic solar cells convert them to electricity.

    And yet with all this going on in your cell phone or on your window, “because the materials do not absorb or emit light in the visible spectrum, they look exceptionally transparent to the human eye,” Lunt says.

    The new technology has potentially myriad applications. It can work in hand-held devices or be scaled up to commercial and even industrial applications at very little cost. “It opens a lot of area to deploy solar energy in a non-intrusive way,” says Lunt.

    Still, there’s the issue of energy efficiency. For now, the device’s solar conversion efficiency is close to 1 percent, though the team’s goal is to optimize it to achieve efficiencies greater than 5 percent. Previous attempts with colored glass had an efficiency of about 7 percent. Conventional solar panels are about 25 percent efficient.

    Lunt says his team will get there some day. “Ultimately, we want to make solar harvesting surfaces that you do not even know are there.”

    By Andy Tully of Oilprice.com

  • Eco-art activities in time for holidays

    This September school holidays, Reverse Garbage at Woolloongabba is introducing some exciting new themes to the Spring eco-art workshop program to coincide with some of 2014’s best new film releases for kids.

    ‘Boxtrolls’ is a quirky film opening in cinemas this September that encourages children to “dare to be square,” and children can make their own trash collecting Boxtroll character or cardboard box costume in the workshop. Boxtrolls is one of many themes that kids can participate in with ‘Furry Friends,’ ‘Wearable Art’ and ‘Pirates and fairies’ among the other activities available.

    “Using offcuts and discards as craft materials presents a fun challenge that gets kids thinking laterally and demonstrates ways they can re-use materials that have been reclaimed from the waste stream,” says workshop facilitator, Mercedes Walters.

    “Using leftover pieces of new materials from the manufacturing industry, children can see that not all things thrown away are broken or dirty. We demonstrate craft activities using clean, salvaged materials and give children the opportunity to use their imagination to experiment, play and repurpose”.

    Reverse Garbage September Spring School Holiday Eco-Art Workshops run from Tuesday 23 September – Thursday 2 October, 2014. See the full program outline below. All workshops are held at Reverse Garbage, 20 Burke St Woolloongabba.


    What – Spring School Holiday Eco-Art Workshops

    When – Tuesday 23 September – Thursday 2 October, 2014

    Where – Reverse Garbage, 20 Burke St, Woolloongabba

    Cost – $20 per child (includes tuition from experienced artists, tools and materials)

    For full holiday schedule, visit: www.reversegarbage.com.au