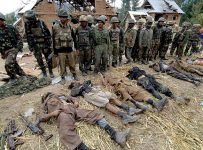
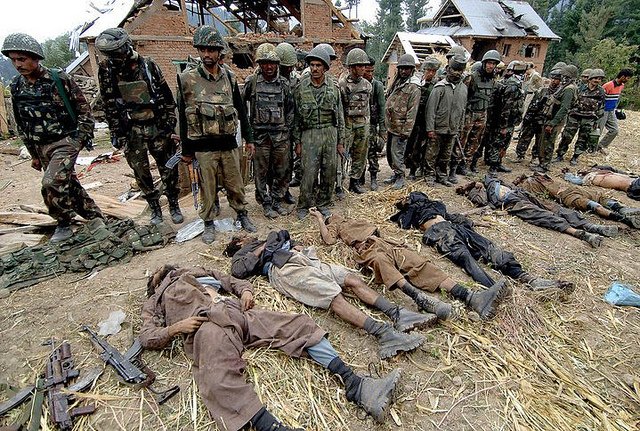
KashmirGlobal photograph of corpses killed in border war
Kashmir is mired in lockdown with strict curfews keeping residents in their homes without the use of telephones and internet as the ongoing territorial dispute between India and Pakistan escalates.
India’s home minister has accused Pakistan of being a terrorist state and Pakistan’s defense minister has threatened to use nuclear weapons. India has also threatened to revoke the 56 year old Indus Water Treaty that governs the sharing of water from the Indus River that flows through Kashmir.
Water is an increasingly scarce resource in the region as water tables fall due to pumping of ground water and Himalayan ice disappears.
/glacial-melt-threatens-2billion/
Why the India-Pakistan War Over Water Is So Dangerous
As New Delhi and Islamabad trade nuclear threats and deadly attacks, a brewing war over shared water resources threatens to turn up the violence.
How to Stop Kashmir from Spiraling into All-Out War
Kashmir has again become the venue for a confrontation between India and Pakistan. Seeking to restore order, the authorities in Kashmir instituted curfews, shut down newspapers, internet and cellphone services.
The planet is not dying it is being killed and the people killing it have names and addresses, said singer activist and well known wobbly, Utah Phillips.
We talk about the one per cent. It is more like the one in ten million.
If we know the names and addresses of the 700 people who control the wealth and armies of the planet, then we might be able to adjust their behaviour.
Taking the Forbes rich list of 1,900 billionaires and chopping it off at 700 would give us a partial result, but it excludes royalty and dictators. Also, the arms dealers, drug runners, slave traders and engangered animal merchants deliberately keep themselves off the list.
Note that five percent of the 2,000 billionaires on the planet (ie 100 people) own more than $US10,000,000,000 (or to use the Vedic system, 100 crore $1,00,00,00,000). We might take them as our first tranche and see where that gets us.
I find it somewhat refreshing that six of the ten are tech related and there is a fashionista in there as well. Two are financiers and the Koch brothers are the biggest coal barons in the world and among the largest funders of the climate denial campaign of which Senator Malcolm Roberts is the latest outgrowth.
Of course, political power amounts to something even if we cannot simply give every politician that represents one crore of people a place in the one per crore and leave it at that. While that would represent one person one vote, the politicians from the world’s twentiest richest nations wield much more significant power than the one hundred poorer ones.
Note that the Indonesians are set to pass Australia, we might soon be begging for a seat at the G30 if we want to keep our nose in world affairs. The point here is that a small number of relatively underpopulated nations compete with China, India and Brazil, the USA, Indonesia and Russia for a place at the big table.
If we put in a political ofical for every crore of people in the G20 that would give us another 200 candidates for the 700 one per crore. Around 30 of them would be citizens of the USA, and 125 of them members of the Chinese Communist party. Russia would only get 15 places in this slice of the population, but it has around 60 billionaires to build up its numbers. This might be over estimating the power of political influence but it is at least a start.
Now that leaves out world leaders who have scammed their way into the game without declaring their hand.
Aross all time, the world’s most corrupt leaders have been named by Transparency International. A look at their embezzled fortunes, makes you realise how much wealth the truly wealthy have, even when you take inflation into account.
Source: Transparency International Global Corruption Report 2004 (not updated since)
There needs to be a tranche of members based on military influence and then some way of accounting for the crooks.
Cross referencing, updating and fleshing out these sources is just the beginning of a project to identify the One per Crore, the one in ten million people who actually call the shots. That is the 700 people in the world who we might clearly claim are running it. Once we have their names and addresses we can start working on ways to help them manage their affairs more in line with our communal and long term interest.
The Cage welcomes your suggestions on ways to flesh out this list.
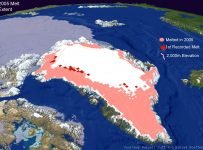
The Greenland ice sheet has melted significcantly over the last decade
At over 400 parts per million, atmospheric CO2 levels are now as high a 3 million years in the Pliocene period. At that time, the world was 3C warmer; oceans were 8 to 25 metres higher, and the world was a dramatically different place.
The West Antarctic and Greenland ice sheets are melting at double the rate they were a decade ago and contain enough ice to raise sea levels over 1.2 metres.
The sea ice in the Arctic continues to disappear at an accelerating rate.
Insurance companies are refusing to insure against impacts of sea level rise and have called on world governments to take immediate and drastic action now.
West Antarctic glaciers have ‘passed point of no return’
Together, all six glaciers contained enough ice to raise global sea levels by 1.2 metres. They drained ice sheets which held ice equivalent to several more metres. Its retreat will also influence adjacent sectors of the West Antarctic ice sheet which could triple this contribution to sea level.
Antarctic ice sheet history and role in rapid sea level rise
Antarctic ice has a history of sudden partial collapse, in fits and starts. The fastest flow of Antarctic icebergs closely matched a period when global sea levels rose by 5 metres a century over a period of 350 years. Antarctica last year lost about 160 billion tonnes of ice to the ocean, compared with about 30 billion tonnes per year during 1992-2001.
A high-resolution record of Greenland mass balance
Greenland Ice Sheet lost one trillion tons of water due to melt during the four-year period from 2011 through 2014. That’s about double theloss during the 1990s through mid-2000s. Subsequently, Greenland’s contribution to sea-level rise also doubled, meaning that Greenland alone contributed 0.75 mm of sea-level rise every year in 2011-14.
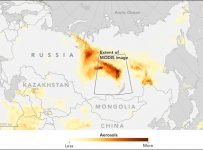
Following a summer of intense drought the forests of Siberia are burning in a climate altering event that is one of the original tipping points predicted by NASA scientists.
Siberian fires cover massive area of the sub-arctic
Over 2 million hectares of forest have burned in the last six months, four times the area incinerated in Australia’s Black Saturday fires in 2009.
The fires release vast amounts of carbon dioxide and water into the atmosphere, accelerating climate chaos and further damaging the landscape. Water does not soak into the scorched earth and so nutrients are swept away further retarding the recovery of the landscape
Russia’s Siberian forests, hit with a severe drought this summer, are increasingly being consumed by wildfires that are consistently underestimated by the government. The fires have destroyed 2 million hectares.
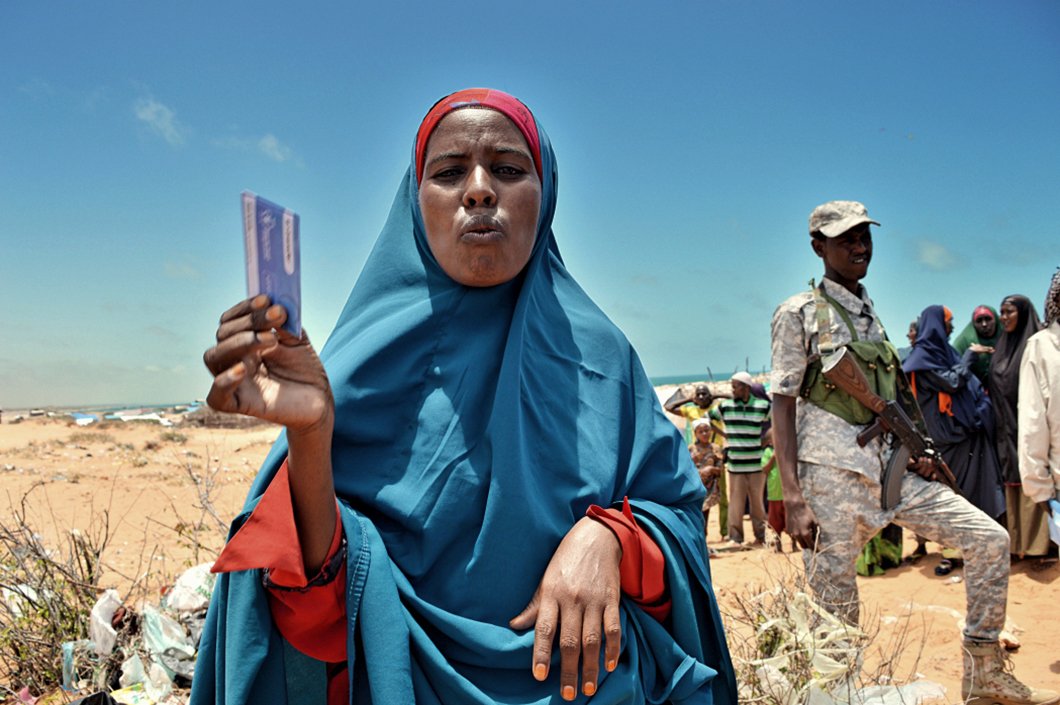
“I was a pauper in Kenya but I am destitute here,” returned Somali, Katra Abii
The world’s largest refugee camp in Dadaab, Kenya is being closed by the Kenyan government as the result of terrorist activity among the 300,000 Somalis living there.
Since December 2014, the United Nations Humanitarian Commission for Refugees (UNHCR) has assisted in the relocation of 24,000 refugees to Somalia.
Refugee activists and non-government-organisations say that refugees are being coerced into relocating. Returning refugees to danger against their will is against the human rights convention among other treaties.
Kenya hosts the world’s seventh largest population of refugees.
The UN Is Sending Thousands of Refugees Back Into a War Zone
Kenya’s plan to close the world’s largest refugee camp involves forced repatriations of Somalis. Why is the UN helping?
UNHCR now appears to be managing a process that violates the cardinal rule of refugee protection: that refugees and asylum-seekers shall not be returned against their will to any country where they face a threat of persecution
Confiscated ivory at the Thai border reveals the extent of the trade
International poaching organizations have moved 16,000 illegally killed elephants through Laos with the assistance of corrupt officials placed as highly as the office of the Prime Minister. Three major trafficking organisations have been identified as working with corrupt officials to move millions of dollars worth of animal parts out of the country.
A summit of global governments in Africa last week totally banned trade in Pangolins, a scaly anteater that has been slaughtered in millions for the last decade.
Endangered animals are fourth behind human slaves, arms and drugs as the most lucrative trade in the world.
Laos Authorities Help Smuggle Exotic Wildlife for Kickbacks
Thousands of frozen Pangolin carcasses prior to incineration
The office of the Laos prime minister collaborated with three major trafficking organizations to move millions of dollars worth of animal body parts across borders, killing hundreds of tigers and rhinos and more than 16,000 elephants.