Category: Climate chaos

The atmosphere is to the earth as a layer of varnish is to a desktop globe. It is thin, fragile and essential for preserving the items on the surface.150 years of burning fossil fuel have overloaded the atmosphere to the point where the earth is ill. It now has a fever. Read the detailed article, Soothing Gaia’s Fever for an evocative account of that analogy. The items listed here detail progress on coordinating 6.5 billion people in the most critical project undertaken by humanity. 

  • The Future We Need


    Tell a Friend

    Subscribe


    Footprint Network Blog
    Our Partners
    Ecological Footprint
    Newsroom
    About Us

    About Global Footprint Network

    Our mission is to promote a sustainable economy by advancing the Ecological Footprint, a measurement tool that makes the reality of planetary limits relevant to decision-makers.

    Advisory Council

    E.O. Wilson
    Manfred Max-Neef
    Rhodri Morgan
    David Suzuki
    Emil Salim
    Julia Marton-Lefèvre
    William E. Rees
    Lester Brown
    Jorgen Randers
    M S Swaminathan
    Daniel Pauly
    Eric Garcetti
    Ernst Ulrich von Weizsäcker
    Michael Meacher
    Karl-Henrik Robèrt
    Will Steffen
    Dominique Voynet
    Fabio Feldman
    Oscar Arias
    Peter Raven
    Mick Bourke
    Norman Myers
    Gus Speth
    Stephen Groff

    The Future We Need

    Letter from the Editor: The Future We Need

    As the world’s leading resource accountant, Global Footprint Network measures trends. Too often, our data reveals worrisome trends. The Ecological Footprint accounting tool, the gold standard for measuring how much biocapacity we have and how much we use, shows most countries—and the entire world—going further into ecological overshoot. It was a message we delivered repeatedly at the Rio+20 Earth Summit last month.

    We see other trends, too—trends that give hope, trends that make us believe that we can still reverse the tide. Sometimes, they are hard to recognize. Amid the gloom of recent weeks, for example, anyone would have been hard-pressed to remain optimistic. Consider, first, the headlines.


    Honors for Ecological Footprint work

    Our Ecological Footprint work was honored with two significant prizes last month in Rio de Janeiro. On June 17, Japan’s Asahi Glass Foundation awarded the prestigious Blue Planet Prize to Mathis Wackernagel, Global Footprint Network’s president, and Bill Rees, Professor Emeritus at the University of British Columbia, in recognition of their work in developing the Ecological Footprint accounting system. Thomas Lovejoy, Professor at George Mason University, shared the award for his pioneering work in biodiversity conservation, especially in his research on how human-caused habitat fragmentation causes biodiversity loss.


    The Ecological Footprint at Rio+20

    As people move on from the suspense, excitement, and sometimes disappointment that was Rio+20, at least one thing is clear to us—the Ecological Footprint is more important than ever in a world where international cooperation on sustainable development has not delivered everything the world hoped it would.


    Global Footprint Network Science Coordinator Kyle Gracey
    (far right) at the Eye on Earth Panel


    What happens when an infinite-growth economy runs into a
    finite planet?

    Debt boils over. Energy trumps safety. Biodiversity is for sale. And more.

    Resource consumption trends put us on an ecological collision course, risking economic and social stability as we bump up against natural limits. Working within nature’s budget builds the foundation for securing our future. Read our 2011 Annual Report to learn more.


    FEATURES

    Living Planet Report: Our planet’s latest report card generates widespread coverage

    Six weeks ago, André Kuipers, a European Space Agency astronaut, was in a unique vantage point to observe humanity’s impact on the planet. “From space,” he said from the International Space Station, “you see the forest fires, you see the air pollution, you see erosion.”

    Kuipers offered his observation as part of the official launch of WWF’s Living Planet Report 2012, the leading biennial survey of Earth’s health produced in collaboration with Global Footprint Network and the Zoological Society of London. Using Global Footprint Network’s updated National Footprint Accounts, the central data set that calculates humanity’s demand for and supply of natural resources and services they provide, the report’s conclusions are daunting.


    Competitiveness 2.0: A Q&A with Robert Rapier

    Energy expert Robert Rapier, the Chief Technology Officer at Merica International, writes and speaks about issues involving energy and the environment. Merica , a privately held energy company, is involved in a wide variety of projects, with a core focus on the localized use of biomass to energy for the benefit of local populations.
    In this second of a two-part series on Competitiveness 2.0, one of Global Footprint Network’s strategic programs, the Consumer Energy Report columnist and author of “Power Plays: Energy Options in the Age of Peak Oil” explains below how energy constraints are becoming so central to a nation’s competitiveness.


    Footprint Briefs

    A round-up of other Footprint and sustainability news from across the globe, plus a few blog posts you might have missed.


    Click to view this email in a browser

    If you no longer wish to receive these emails, please reply to this message with “Unsubscribe” in the subject line or simply click on the following link: Unsubscribe


    Global Footprint Network
    312 Clay Street
    Suite 300
    Oakland, CA 94607
    United States

    Read the VerticalResponse marketing policy.

    Try Email Marketing with VerticalResponse!

  • Coastal flooding may rise 2000-fold

    News 1 new result for ACECRC’s Report Card: Sea Level Rise 2012
    Coastal flooding may rise 2000-fold
    The Australian
    Co-author of Report Card: Sea Level Rise 2012 and ACECRC sealevel rise expert John Hunter said there would be an average 300-fold increase in coastal flooding nationally by 2100. “This means that a (coastal flooding) event which presently only
    See all stories on this topic »


    This once a day Google Alert is brought to you by Google.

  • Sea level rise planning clause dumped

    Sea level rise planning clause dumped

    0

    THOUSANDS of coastal property owners have been given relief after their council dumped a controversial clause on planning documents which labelled their homes as in danger of sea level rise.

    Residents said the message devalued properties and sent insurance premiums up.

    Gosford City Council last night moved to withdraw a message on planning certificates saying: “This land has been identified as being potentially affected by sea level rise of up to 0.9m by the year 2100”.

    The message triggered more than 500 phone calls and letters from residents concerned about the “lack of consultation, doubt regarding the credibility of the science that supports the sea level rise projections, the effect the encoding may have on property prices and, more recently, the effect on insurance premiums”, council documents said.

    ALP Councillor Jim Macfadyen said there were 56 NSW councils affected but only 16 had put the message on planning certificates.

    “There has been a lot of concern and angst, of property prices falling because of that certificate, concern of insurance companies increasing their premiums, all for a report that looks at an event that may happen in 100 years,” he said.

    “It’s fairly tough that we did that, I think common sense prevailed last night.”

    Mr Macfadyen called on the NSW Government to issue clear regulations for all affected councils.

    “We withdrew them until such time as the State Government ensures the message is consistent across NSW,” he said.

    Coastal Residents Incorporated secretary Pat Aitken said home owners had lost hundreds of thousands of dollars on the values of their homes, and insurance premiums had risen up to 1000 per cent.

    He said he was shocked at suggestions the decline in property values was because of the GFC and had nothing to do with sea level rise policies.

    “The message had a devastating impact on their wellbeing and their livelihoods, people are faced with crystallised losses,” he said.

    “You can’t bury your head in the sand, there has to be away through it. We haven’t seen a real effort to consult and engage. The NSW Government must intervene. There is no consistency in any council that has done this – but there is no way in the world they would get away with it in Woollahra.”

    A report by a council officer said the council could face court action by landholders who believed the loss of value was directly because of the sea level rise warning.

    The same report also said that the council could find itself before the court if it removed the information, saying there is “a risk that a person may instigate action if that person considers that council was aware of a matter and did not disclose that information to the person’s detriment”.

    Four councillors voted to remove the S.149(5) Planning Certificate Message relating to sea level rise until the NSW Government regulates that all councils in NSW to provide a clear direction to property owners affected.

    Two voted against the move, and four councillors did not attend the meeting.

  • Scientists say ongoing weather extremes offer proof of climate change

    Scientists say ongoing weather extremes offer proof of climate change

    Record-shattering heatwaves, wildfires and freak storms are a sampling of what is to come in 2012 and a window to the future

    brookston-minnesota-st.louis river-flood

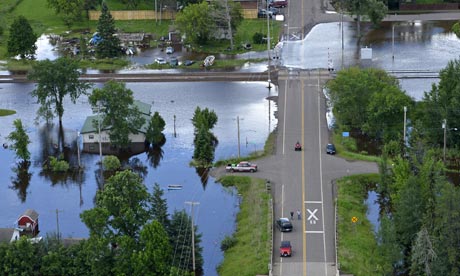
    Brookston in Minnesota is among scores of places across the country witnessing extreme weather. Photograph: Brian Peterson/AP

    The bizarre weather of early summer in the US – from heatwave, wildfires, drought to freak storms – is just a sampling of what is to come for 2012 and a window to the future under climate change, scientists have said.

    Scientists are wary of linking specific weather events to climate change, and this year’s punishing heat and deadly thunder storms have been confined to the Americas. Europe, Asia and Africa haven’t experienced severe weather this year – though they have in past years.

    But the run of extreme weather offers real-time proof of the consequences of climate change, said Kevin Trenberth, who heads climate research at the National Centre for Atmospheric Research in Colorado – itself the scene of devastating wildfires.

    “We are certainly seeing climate change in action,” he said. “This year has been exceptionally unusual throughout the United States.”

    Jeff Masters director of meteorology at the Weather Underground website, told Democracy Now: “What we’re seeing now is the future. We’re going to be seeing a lot more weather like this, a lot more impacts like we’re seeing from this series of heat waves, fires and storms.”

    He added: “This is just the beginning.”

    The prime exhibit for the bizarre turn of weather is the current heat wave.

    The month of June alone shattered some 3,215 records for daily maximum heat. Cities like St Louis were sweltering under five consecutive days of triple digit temperatures on Tuesday. Last Thursday the city registered 108 degrees fahrenheit, the highest temperature in nearly 60 years.

    “Historically this is going to end up being one of the hottest Junes of all time,” said Harold Brooks, a research meteorologist at the National Severe Storm Laboratory in Oklahoma.

    The high temperatures were also hitting earlier this summer, he said. Heat waves ordinarily do not build up until July.

    But this has been a year for record-breaking heat. Since the start of the year, the United States set more than 40,000 hot temperature records and fewer than 6,000 cold temperature records, according to the National Oceanic and Atmospheric Administration.

    Ordinarily, scientists would expect those numbers to be about the same, but the hot temperature records were falling at a ratio of about 7-1.

    Such volatile temperatures, early in the year, helped contribute to the conditions for the deadly derecho thunder storm which blew through the Washington DC area with hurricane-force winds, killing some 22 people. Brooks said it was one of the most powerful such storms in recent history.

    On the other side of the country, meanwhile, extreme drought conditions across a vast swathe of the American west led to an outbreak of mega-fires in Arizona, Colorado, and New Mexico.

    Colorado’s fires, outside the cities of Colorado Springs and Boulder, have between them destroyed more than 650 houses.

    And there was no relief in sight. Aside from pockets such as northern Minnesota, Washington state, and New England, temperatures across a vast swathe of the United States were heading to record hot temperatures, Brooks said.

    The season has already raised public health concerns. At least three people, all in their 70s and 80s, have died in St Louis since last week because of heat-related illness, medical officials said.

    In the greater Washington DC area, where power outages due to the furious thunderstorm deepened the effects of a heat wave, the authorities have opened cooling centres in schools and community centres for those without access to air conditioning.

    “Watch out for a long hot summer,” said Trenberth.

    Suzanne Goldenberg and Jeff Masters discuss wildfires and climate change on Democracy Now!

  • Arctic sea-ice takes a nose dive

    Arctic sea-ice takes a nose dive

    Posted: 03 Jul 2012 12:40 AM PDT

    Neven Acropolis, a Climate Progress cross-post

    Arctic sea ice area for June in recent years. Source: Cryosphere Today

    If you want to mislead people into thinking that there is nothing weird going on in the Arctic, you have to do it during winter. In winter things almost look normal on some graphs, with gaps between trend lines and long-term averages not as ridiculously big as during spring and summer.  If you’re lucky, anomalous weather patterns can make those trend lines come real close to the long-term average, and you’ll have a couple of weeks of shouting ‘recovery’, ridiculing scientists and suggesting graphs are being cooked. It’s an annual ritual on pseudo-skeptic blogs, which is only logical. The Arctic is becoming ever more problematic for their life work, i.e. denying AGW could ever be a problem and thus delaying any meaningful action on mitigating the consequences of AGW. Thank God water still freezes in winter.

    Sea ice extent maximum on the left (18 March) and how it looks now on the right (15 June)  (source: NSIDC)

    But what happens in winter is only interesting in so far as it influences the melting season that comes after it. The fact that this year saw a late finish to the freezing season, with an extreme expansion of sea ice into the Bering Sea, was far from irrelevant, but it didn’t tell the whole story either. Another part of that story was covered in a guest blog on Climate Progress in February (Arctic Sea Ice Update: Spectacular and Ominous), and the whole story as I saw it was told in the 2011/2012 Winter Analysis on the Arctic Sea Ice blog. It quite simply came down to this: “Sea ice on the Atlantic side of the Arctic looks vulnerable, sea ice on the Pacific side should be thicker.”
    The melting season is well underway now and in the last two weeks sea ice has been disappearing so fast that 2012 is leading all other years on practically all sea ice extent and area graphs. Take for instance the top graph I’ve made, based on Cryosphere Today sea ice area data.
    That looks pretty spectacular, doesn’t it? Sea ice area has never been so low for this date in the satellite record, not even close to it. 2012 has over half a million of square kilometres less ice than record minimum years 2007 and 2011.
    There was a distinct possibility this would happen, although I didn’t expect it to happen quite this early. But now that it has happened, it’s not difficult to see what the causes are. First of all, the extra ice in the Bering Sea that caused the late maximum, was wafer-thin and so has now virtually disappeared (I compared this year’s situation with previous years in this post on the ASI blog). All the easy ice is as gone as the easy oil.
    Second, that vulnerability on the Siberian side of the Arctic is becoming ever more visible, with the Northern Sea Route possibly opening up for commercial shipping very early this year.

    A third reason for the recent rapid decline is the widespread formation of melt ponds on ice floes. These are fooling satellite sensors into believing that there is open water where there actually isn’t, causing sea ice area to go down faster than sea ice extent. The NSIDC FAQ page explains it well:

    A simplified way to think of extent versus area is to imagine a slice of Swiss cheese. Extent would be a measure of the edges of the slice of cheese and all of the space inside it. Area would be the measure of where there is cheese only, not including the holes. That is why if you compare extent and area in the same time period, extent is always bigger.

    One could say those melt ponds are making the trend lines artificially low, especially on sea ice area graphs. Although this is true, it isn’t the only reason for the recent nosedive and at the same time it’s an indication of how much the Sun is beating down on the Arctic right now. We are approaching Summer Solstice, meaning that the Sun shines practically all day in these northern latitudes, and thus heat will accumulate everywhere where there are clear skies and no ice to reflect the incoming sunshine.
    This effect has started to become visible on the sea surface temperature anomalies all around the Arctic:

    Source: Danish Meteorological Institute

    The water seems to be warming up big time in the polynyas that recently opened up, especially in the Kara and Barents Seas, that are ‘coincidentally’ thought to be a source for some of the blocking patterns that cause outbursts of cold air to spill out from the Arctic and cause extreme winter conditions further down on the Northern Hemisphere (also known as WACC, Warm Arctic Cold Continents).
    One could also say that the stage is being set for the latter part of the melting season, as sea surface temperatures play a big role in the final outcome of the melting season. But that’s a worry for later. What can we expect in the short-term? Will trend lines continue to plummet?
    Short answer: I don’t think they will. The weather conditions that let all that built-up melting potential come to fruition, are in the process of switching. And although this means that those Siberian Seas are also going to get a good dose of sunshine, and the Northwest Passage (which is still chock-full of ice right now) will start opening up as well, the speed of the decline will probably level off a bit on those sea ice extent and area graphs. Until weather conditions switch again, of course.
    Because if one thing is clear after the first phase of the melting season, it’s that there’s a very high chance of records being broken again if this year’s weather conditions resemble those of last year or 2010. If they resemble those of 2007, the year of the perfect storm, it will become clearer than ever that something weird and potentially dangerous is going on in the Arctic.
    I’ll report again if and when something worthwhile happens. In the meantime go to the Arctic Sea Ice blog if you want to read more regular and detailed updates. And check the daily updated graphs, maps and webcams on the Arctic Sea Ice Graphs website.

    Neven Acropolis oversees the Arctic Sea Ice blog.

    You are subscribed to email updates from climate code red
    To stop receiving these emails, you may unsubscribe now.
    Email delivery powered by Google
    Google Inc., 20 West Kinzie, Chicago IL USA 60610
  • Sharp rise in sea levels to Australia’s north: report

    Sharp rise in sea levels to Australia’s north: report

    July 3, 2012 – 10:30AM

    Leading Australian scientists have firmed their view on the rate of sea-level rise, in the latest snapshot of this climate change problem.

    Over the past 50 years, the global average rise of 1.9 millimetres a year measured in tide gauges has been confirmed in satellite measurements, raising confidence in predictions.

    “We are very close to the final answer on this,” said oceanographer John Hunter, of the Antarctic Climate and Ecosystems Co-operative Research Centre in Hobart. “Once we do that we can do our modelling for the future much better.”

    In the ACECRC’s Report Card: Sea Level Rise 2012 released today, a dramatic short-term rise was identified north of Australia, where waters rose at around 10mm each year over the past 18 years.

    But Dr Hunter cautioned that this was likely to relate to El Nino events, rather than long term sea-level trends.

    He said the Australian coasts faced a rise of about the global average rate through the 21st century – meaning sea level would be around 0.38 metres higher in 2090 than it was 100 years earlier.

    Thermal expansion – the greater space occupied by hotter sea water – has contributed about 45 per cent of the total rise since 1972, according to the report card.

    Melting glaciers and ice caps added another 40 per cent, with most of the remainder coming from ice sheets.

    The report card warns that as a rule of thumb, a 0.1m rise in sea level increased the frequency of flooding by about a factor of three.

    “This effect is multiplicative so that even a relatively modest increase in mean sea level of 0.5 m will increase the frequency of flooding by a factor of roughly 300,” it said.

    “This means that an event which presently only happens on average once every 100 years (the ‘100-year return event’) will happen several times a year after sea level has risen by 0.5 m.”

    Dr Hunter said with new data submissions to the International Panel on Climate Change set to close within weeks, the report card represented the state of play on sea level rise as it was likely to be in the IPCC’s 2014 report.

    Read more: http://www.smh.com.au/environment/climate-change/sharp-rise-in-sea-levels-to-australias-north-report-20120703-21e6n.html#ixzz1zXK1bDP6