Category: General news

Managing director of Ebono Institute and major sponsor of The Generator, Geoff Ebbs, is running against Kevin Rudd in the seat of Griffith at the next Federal election. By the expression on their faces in this candid shot it looks like a pretty dull campaign. Read on

  • Parramatta Road plan: dig it up for tunnel

    Parramatta Road plan: dig it up for tunnel

    EXCLUSIVE

    Overhaul ... Parramatta Road is part of Infrastructure NSW's $10 billion to $15 billion plans for three new motorways across Sydney.

    Overhaul … Parramatta Road is part of Infrastructure NSW’s $10 billion to $15 billion plans for three new motorways across Sydney.

    PARRAMATTA ROAD would be carved open and an eight-lane motorway dug beneath in plans being developed for a huge expansion of Sydney’s tollway network.

    The plans, being drawn up by the government’s infrastructure adviser, Infrastructure NSW, envisage three new motorways in Sydney, to be paid for partly by a new tolling system across the city.

    The motorways – another M5 East tunnel, an M4 East running beneath Parramatta Road connecting to the city, Botany and the airport, and a link between the F3 and M2 – would be presented as one package to transform the economy of Sydney.

    But they would cost $10 billion to $15 billion in government money, as well as tolls. And the scale of the projects would make any other big investment in transport beyond the north-west rail link unlikely for decades.

    Details of the plans remain patchy, with Infrastructure NSW not due to release its state infrastructure strategy to the O’Farrell government for another month. But officials and industry sources reveal a number of differences with previous proposals for an M4 East and M5 tunnel duplication.

    One of the main differences is that the new plans contemplate cheaper but more “high impact” construction techniques – ”more surface construction to make construction cheaper”, one source said. Another source said this meant using “cut-and-cover” construction along Parramatta Road.

    Previous plans for an M4 East tunnel envisaged drilling underground to extend the M4 from Strathfield closer to the city, with minimal disruption to the surface.

    The cut-and-cover techniques would require tearing up sections of Parramatta Road, laying a motorway underneath, and relaying the surface road on top of the tunnel.

    This would be significantly cheaper but intensely disruptive. It would probably also require the acquisition of property next to the road.

    Another difference is that the new M5 East tunnel would connect to the extended M4 East near Sydney Airport. The M4 East would reach the airport by following the Alexandra Canal.

    ”It is no secret that Infrastructure NSW is considering a range of motorway projects – and specifically the M4 and M5 – as part of developing a 20-year state infrastructure strategy,” a spokeswoman said.

    ”Infrastructure NSW is looking at a number of options that are aimed at one outcome: growing the NSW economy.”

    The motorways would have dedicated truck lanes to improve freight access to Port Botany. Tolls would be reintroduced on the M4.

    The development of the motorway plans comes amid sharpening divisions within the government over transport policy.

    On Saturday the Herald revealed the top bureaucrat in the state transport department Transport for NSW, Les Wielinga, had quit the board of Infrastructure NSW last month.

    Transport for NSW and Infrastructure NSW, established under the chairmanship of the former premier Nick Greiner, will unveil their respective plans for the state in coming months and they are expected to be completely at odds.

    Infrastructure NSW will make the motorway plan a priority, while Transport for NSW will emphasise public transport. Mr Wielinga could not defend both.

    It is understood Infrastructure NSW has had talks with private equity firms about making the package of motorway projects attractive to foreign investors and superannuation funds.

    It is understood that Infrastructure NSW – not Transport for NSW – is pushing to manage construction and financing.

    The government does not have to follow the recommendations of Infrastructure NSW, meaning the adviser’s plans for Parramatta Road are not a fait accompli. But the government does have to release the plans to the public once it has received them.

    Mr Greiner has often spoken of the need to redevelop Parramatta Road, saying it resembled ”Beirut on a bad day”.

    Last year the NRMA proposed running light rail down Parramatta Road in the event an M4 East tunnel was built. But it is unlikely that Infrastructure NSW’s plan recommends this.

  • A degree by degree explanation of Global Warming

    A degree by degree explanation of Global Warming

    Even if greenhouse emissions stopped overnight the concentrations already in the atmosphere would still mean a global rise of between 0.5 and 1C. A shift of a single degree is barely perceptible to human skin, but it’s not human skin we’re talking about. It’s the planet; and an average increase of one degree across its entire surface means huge changes in climatic extremes.

    Six thousand years ago, when the world was one degree warmer than it is now, the American agricultural heartland around Nebraska was desert.

    The effect of one-degree warming, therefore, requires no great feat of imagination.

    Want to read what it will be like under 2 degrees, or six? Click here.

    “The western United States once again could suffer perennial droughts, far worse than the 1930s. Deserts will reappear particularly in Nebraska, but also in eastern Montana, Wyoming and Arizona, northern Texas and Oklahoma. As dust and sandstorms turn day into night across thousands of miles of former prairie, farmsteads, roads and even entire towns will be engulfed by sand.”

    What’s bad for America will be worse for poorer countries closer to the equator. It has beencalculated that a one-degree increase would eliminate fresh water from a third of the world’s land surface by 2100. Again we have seen what this means. There was an incident in the summer of 2005: One tributary fell so low that miles of exposed riverbank dried out into sand dunes, with winds whipping up thick sandstorms. As desperate villagers looked out onto baking mud instead of flowing water, the army was drafted in to ferry precious drinking water up the river – by helicopter, since most of the river was too low to be navigable by boat. The river in question was not some small, insignificant trickle in Sussex. It was the Amazon.

    While tropical lands teeter on the brink, the Arctic already may have passed the point of no return. Warming near the pole is much faster than the global average, with the result that Arctic icecaps and glaciers have lost 400 cubic kilometres of ice in 40 years. Permafrost – ground that has lain frozen for thousands of years – is dissolving into mud and lakes, destabilising whole areas as the ground collapses beneath buildings, roads and pipelines. As polar bears and Inuits are being pushed off the top of the planet, previous predictions are starting to look optimistic. Earlier snowmelt means more summer heat goes into the air and ground rather than into melting snow, raising temperatures in a positive feedback effect. More dark shrubs and forest on formerly bleak tundra means still more heat is absorbed by vegetation.

    Out at sea the pace is even faster. Whilst snow-covered ice reflects more than 80% of the sun’s heat, the darker ocean absorbs up to 95% of solar radiation. Once sea ice begins to melt, in other words, the process becomes self-reinforcing. More ocean surface is revealed, absorbing solar heat, raising temperatures and making it unlikelier that ice will re-form next winter. The disappearance of 720,000 square kilometres of supposedly permanent ice in a single year testifies to the rapidity of planetary change. If you have ever wondered what it will feel like when the Earth crosses a tipping point, savour the moment.

    Mountains, too, are starting to come apart. In the Alps, most ground above 3,000 metres is stabilised by permafrost. In the summer of 2003, however, the melt zone climbed right up to 4,600 metres, higher than the summit of the Matterhorn and nearly as high as Mont Blanc. With the glue of millennia melting away, rocks showered down and 50 climbers died. As temperatures go on edging upwards, it won’t just be mountaineers who flee. Whole towns and villages will be at risk. Some towns, like Pontresina in eastern Switzerland, have already begun building bulwarks against landslides.

    At the opposite end of the scale, low-lying atoll countries such as the Maldives will be preparing for extinction as sea levels rise, and mainland coasts – in particular the eastern US and Gulf of Mexico, the Caribbean and Pacific islands and the Bay of Bengal – will be hit by stronger and stronger hurricanes as the water warms. Hurricane Katrina, which in 2005 hit New Orleans with the combined impacts of earthquake and flood, was a nightmare precursor of what the future holds.

    Most striking of all was seeing how people behaved once the veneer of civilisation had been torn away. Most victims were poor and black, left to fend for themselves as the police either joined in the looting or deserted the area. Four days into the crisis, survivors were packed into the city’s Superdome, living next to overflowing toilets and rotting bodies as gangs of young men with guns seized the only food and water available. Perhaps the most memorable scene was a single military helicopter landing for just a few minutes, its crew flinging food parcels and water bottles out onto the ground before hurriedly taking off again as if from a war zone. In scenes more like a Third World refugee camp than an American urban centre, young men fought for the water as pregnant women and the elderly looked on with nothing. Don’t blame them for behaving like this, I thought. It’s what happens when people are desperate.

    Chance of avoiding one degree of global warming: zero.

    Want to read what it will be like under 2 degrees, or six? Click here.

  • CODE RED A Dark Victory: How vested interests defeated climate science

    climate code red


    Climate News

    Posted: 04 Aug 2012 08:09 PM PDT

    Week ending 5 August 2012

    Arctic sea-ice volume (red line is 2012) from 
    https://sites.google.com/site/arctischepinguin/home/piomas

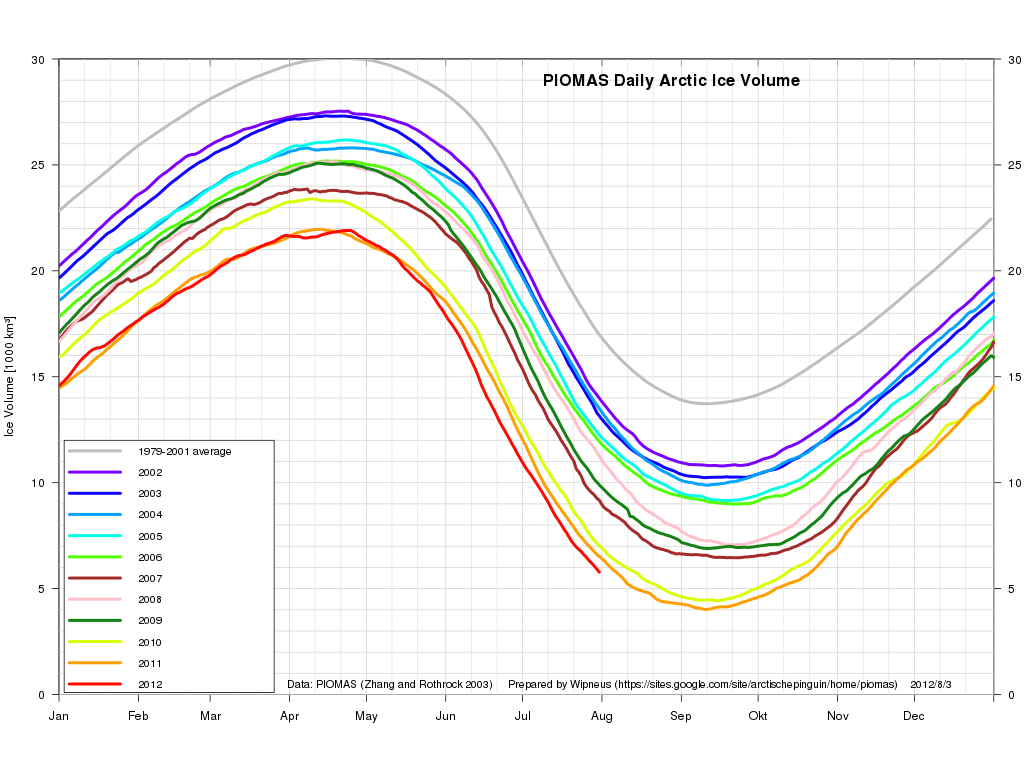
    Arctic Death Spiral Continues: Record Low Sea Ice Volume Appears Likely
    http://thinkprogress.org/climate/2012/08/04/634901/arctic-death-spiral-continues-new-record-low-sea-ice-volume-appears-likely
    Neven, Climate Progress, 4 August 2012
    I think it’s pretty safe to say that we’re going to have a new record volume low, although the difference with 2010 and 2011 has become smaller. Right now it’s 1249 and 730 km3 respectively.

    More Arctic charts
    https://sites.google.com/site/arctischepinguin/home/piomas


    PICKS OF THE WEEK

    Climate policy and our sphere of influence
    http://inside.org.au/climate-policy-sphere-of-influence/
    Fergus Green, Inside Story, 2 August 2012
    Our policies have focused on the small portion of emissions that we account for within Australia. It’s time to start thinking about how we can influence emissions beyond our borders.

    Victory declared for the climate denialists
    http://www.abc.net.au/unleashed/4169648.html
    Graham Readfearn, The Drum, 2 August 2012
    A victory has been declared in the field of climate change, but the lap of honour is not being run by research scientists or renewable energy bosses, or by coral reefs, drought-stricken farmers or the citizens of low-lying countries.
    ESSAY
    A Dark Victory: How vested interests defeated climate science
    http://www.themonthly.com.au/how-vested-interests-defeated-climate-science-dark-victory-robert-manne-5853
    Robert Manne, The Monthly, August 2012
    As greenhouse gas emissions have continued to rise, as evidence of global warming has continued to grow, as the unwillingness of the world to act to curb emissions has become increasingly clear, a determination not to notice the looming catastrophe has taken hold of large parts of the population.

    Sustainability: the word you shouldn’t use
    http://www.guardian.co.uk/sustainable-business/sustainability-word-you-shouldnt-use
    Tony Calandro, Guardian, 3 August 2012
    A new study shows that understanding a company’s business objectives and avoiding sustainability jargon is the secret to successful sustainability leadership

    Farmers: Biofuels Quota Exacerbating ‘Food Crisis’
    http://www.commondreams.org/headline/2012/07/31-0
    Suzanne Goldenberg, The Guardian, July 31, 2012
    Some of the largest farmers in the US are warning the government that the mandated biofuels provisions that demand grain crops to be converted into ethanol for gasoline will make an impending “food crisis” much worse

    Visualising climate change
    http://talkingclimate.org/visualising-climate-change/
    How can some­thing that is largely ‘invis­ible’ be com­mu­nic­ated using visual tools? This is the ques­tion that Professor Stephen Sheppard asks in this guest blog post, sum­mar­ising some of the research in his new book ‘Visualizing Climate Change‘.

    FOCUS ON EXTREME WEATHER AND CLIMATE CHANGE

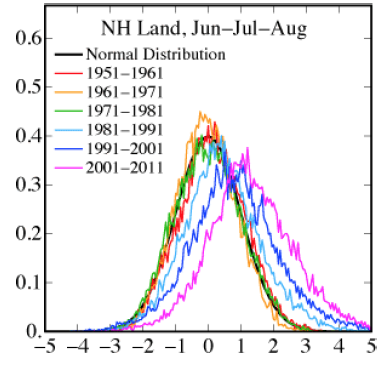
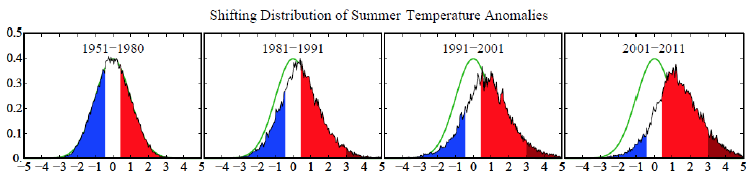
    Climate Change Study Ties Recent Heat Waves To Global Warming
    http://www.huffingtonpost.com/2012/08/04/climate-change-heat-wave-global-warming_n_1742653.html
    Seth Borenstein, Huffington Post, 4 August 2012
    The relentless, weather-gone-crazy type of heat that has blistered the United States and other parts of the world in recent years is so rare that it can’t be anything but man-made global warming, says a new statistical analysis from a top government scientist.

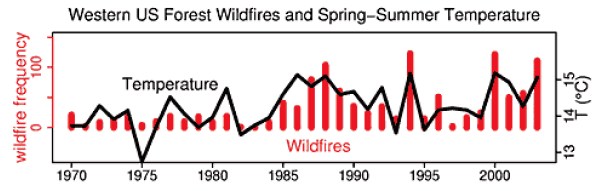
    Chronic 2000-04 Drought, Worst in 800 Years, May Be the ‘New Normal’
    http://www.sciencedaily.com/releases/2012/07/120729142137.htm
    ScienceDaily, July 29, 2012
    The chronic drought that hit western North America from 2000 to 2004 left dying forests and depleted river basins in its wake and was the strongest in 800 years, scientists have concluded, but they say those conditions will become the “new normal” for most of the coming century.

    Perth on track for driest July on record
    http://www.abc.net.au/news/2012-07-30/perth-on-track-for-driest-july-on-record/4164674
    ABC News,  July 31, 2012
    Perth is on track to record its driest July since records began more than 100 years ago. The city has received just 30 millimetres of rain this month, well below the 170 millimetre average

    1988 vs 2012: How heat waves and droughts fuel climate perception
    http://www.eenews.net/public/climatewire/2012/07/30/2
    Nathanael Massey, ClimateWire, July 30, 2012
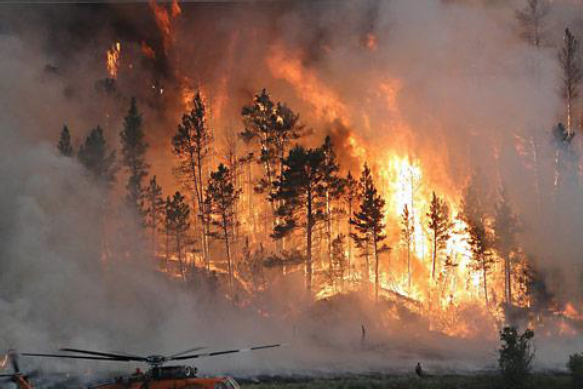
    A crop-searing drought grips the Midwest and Southeast. In the Rocky Mountains, extraordinary “superfires” rip through thousands of acres of high-elevation pine. The Mississippi River runs so low that barge traffic must be slowed, at times suspended. Across the country, roads buckle under the heat.

    Juiced by Climate Change: Extreme Weather On Steroids
    http://thinkprogress.org/climate/2012/08/01/622111/juiced-by-climate-change-extreme-weather-on-steroids
    Stephanie Hanson Damassa and Noreen Nielsen, CAP, 1 August 2012
    The brutal summer of 2012 is what climate change looks like. It’s only the beginning of August, and yet nearly every corner of the United States has suffered through extreme weather such as oppressive heat waves, damaging storms, and devastating droughts and wildfires

    When It Rains, It Pours: New Study Finds Extreme Snowstorms And Deluges Are Becoming More Frequent And More Severe
    http://thinkprogress.org/climate/2012/07/31/616441/when-it-rains-it-pours-new-study-finds-extreme-snowstorms-and-deluges-are-becoming-more-frequent-and-more-severe
    Climate Progress, July 31, 2012
    As our climate warms, wet areas will generally get wetter (and dry areas drier). One of the consequences of global warming is the severity and frequency of rain and snow storms – fueled by the increase moisture in the atmosphere as the air warms.

    Climate change the cause of summer’s extreme weather, Congress told
    http://www.guardian.co.uk/environment/2012/aug/01/climate-change-extreme-weather-congress
    Suzanne Goldenberg, Guardian, 1 August 2012
    IPCC scientists tell Senate committee drought, wildfires and hurricanes are becoming normal because of climate change.

    ‘When It Rains, It Pours’: Global Warming Brings Increased, Heavier Storms
    http://www.commondreams.org/headline/2012/07/31-4
    Common Dreams, July 31, 2012
    The impacts of human-caused global warming are being felt across the U.S. as increased and heavier storms — predicted by climate scientists — are confirmed in a report released Tuesday.

    ENERGY AND INNOVATION

    Project’s woes raise questions about brown coal’s future
    http://www.abc.net.au/worldtoday/content/2012/s3557214.htm
    Simon Lauder, TWT, July 31, 2012 
    The apparent failure of a brown coal power plant has cast doubt over Victoria’s plans to become a major coal exporter.

    Smelling a leak: Is the natural gas industry buying academics?
    http://grist.org/natural-gas/smelling-a-leak-is-the-natural-gas-industry-buying-academics/
    Tim McDonnell. Grist, 30 July 2012
    Last week, the University of Texas provost announced he would reexamine a report by a UT professor that said fracking was safe for groundwater after the revelation that the professor pocketed hundreds of thousands of dollars from a Texas natural gas developer. It’s the latest fusillade in the ongoing battle over the basic facts of fracking in America

    National Renewable Energy Laboratory: Solar Has The Most Potential Of Any Renewable Energy Source
    http://thinkprogress.org/climate/2012/07/30/606271/national-renewable-energy-laboratory-solar-has-the-most-potential-of-any-renewable-energy-source/
    Climate Progress,  July 30, 2012
    A recently released study by the National Renewable Energy Laboratory, estimates that the technical potential of photovoltaic cells and concentrated solar power (CSP) in the United States is as much as 200,000 Gigawatts, enough to generate about 400,000 TWh of energy annually.

    Shale gas extraction on the rise in Australia
    http://www.abc.net.au/pm/content/2012/s3559469.htm
    ABC PM, 2 August 2012
    The shale gas revolution that’s causing huge controversy in the United States is gathering pace in Australia. Some proponents say shale gas production could be bigger than the coal seam industry. 

    Utility scale PV market in Australia “about to take off” – First Solar
    http://.com.au/2012/utility-scale-pv-market-in-australia-about-to-take-off-first-solar-96881
    Giles Parkinson, reneweconomy, 3 August 2012
    US solar PV manufacturing giant First Solar has made a bullish assessment of the Australian market, saying the utility-scale sector is about to take off. But it may have more attractive options in markets such as Chile.

    Devil in detail of Renewable Energy Target Review
    http://www.climatespectator.com.au/commentary/devil-detail-renewable-energy-target-review
    Tristan Edis, Climate Spectator, 3 August 2012
    The Climate Change Authority is due to provide an issues paper this month outlining the kinds of things it will consider in its review of the Renewable Energy Target.

    Australian energy cost estimates: experts respond
    http://theconversation.edu.au/australian-energy-cost-estimates-experts-respond-8562
    Andrew Blakers and Kenneth Baldwin,The Conversation, 31 July 2012
    Renewable energy sources such such as solar photovoltaic and onshore wind could generate the lowest electricity costs in Australia by 2030, according to a report released today by the Bureau of Resources and Energy Economics.

    Record Efficiency for Next-Generation Solar Cells
    http://www.sciencedaily.com/releases/2012/07/120729142319.htm
    ScienceDaily, July 29, 2012
    Researchers ave made a breakthrough in the development of colloidal quantum dot (CQD) films, leading to the most efficient CQD solar cell ever.

    POLITICS AND POLICY

    Baillieu back-pedals on environmental protection
    http://www.theage.com.au/opinion/politics/baillieu–backpedals-on-environmental-protection-20120729-235r1.html
    Kelly O’Shanassy, the Age, July 30, 2012
    Bipartisan efforts to safeguard the environment appear to be over with the Baillieu government taking environmental protection backwards faster than any Victorian state government since the 1950s.

    The new environmentalism: where men must act ‘as gods’ to save the planet
    http://www.guardian.co.uk/commentisfree/2012/aug/01/neogreens-science-business-save-planet
    Paul Kingsnorth, Guardian, 1 August 2012
    For the neogreens, science and business will provide while nature can adapt. It is a messsage gaining traction

    We Can Reforest the Earth
    http://www.earth-policy.org/book_bytes/2012/wotech10_1
    Lester R. Brown, EPI, 31 July 2012
    Protecting the 10 billion acres of remaining forests on earth and replanting many of those already lost are both essential for restoring the earth’s health.

    Climate Emergency Action Plan
    http://www.yesmagazine.org/blogs/sarah-van-gelder/climate-emergency-action-plan-5-ways-we-can-still-avert-catastrophe
    Sarah van Gelder, Yes, July 20, 2012
    We can still avoid a devastating climate crisis. But we’ll need a World War II-level mobilization. And we’ll need to stand up to Dirty Energy

    Carbon price gloom eases
    http://www.theage.com.au/opinion/political-news/carbon-price-gloom-eases-20120729-236jx.html
    Michelle Grattan, the Age, July 30, 2012
    A majority of Australians say the carbon price’s introduction has made no difference to them, according to an Age/Nielsen poll that shows Labor slightly narrowing the opposition’s two-party lead.

    SCIENCE AND IMPACTS

    Tightened constraints on the time-lag between Antarctic temperature and CO2 during the last deglaciation
    http://www.clim-past.net/8/1213/2012/cp-8-1213-2012.html
    We show that the increase in CO2 likely lagged the increase in regional Antarctic temperature by less than 400 yr and that even a short lead of CO2 over temperature cannot be excluded. This result, consistent for both CO2 records, implies a faster coupling between temperature and CO2 than previous estimates, which had permitted up to millennial-scale lag

    Nature soaks up more greenhouse gases, brakes warming
    http://af.reuters.com/article/energyOilNews/idAFL6E8J18R120120801
    Alister Doyle, Reuters, 1 August 2012 
    Oceans and land have more than doubled the amount of greenhouse gases they absorb since 1960 in new evidence that nature is helping to brake global warming, a study showed on Wednesday.

    Greenland Meltdown Driven by Collapse of Glaciers at Ocean Outlets
    http://www.scientificamerican.com/article.cfm?id=greenland-glacier-meltdown-at-outlets-slideshow
    David Biello, Scientific American, August 2, 2012
    The interactions between the island’s glaciers and the surrounding seas may be driving ice loss, according to aerial photographs

    Climate Change’s Costs Hit the Plate
    http://www.homerdixon.com/2012/07/24/climate-change%E2%80%99s-costs-hit-the-plate/
    Thomas  Homer-Dixon, Toronto Globe and Mail, July 24, 20
    In the past few years, agricultural scientists have shown that crops critical to humankind’s caloric supply – including corn and soybeans – are extremely sensitive to even short periods of high temperature. Output of these crops increases as the temperature rises to about 30 Celsius, but then it falls sharply as the temperature keeps rising.

    Study Shows Planet Keeping Pace With CO2 Emissions
    http://www.climatecentral.org/news/new-study-shows-planet-keeping-pace-with-co2-emissions/
    Michael D. Lemonick, Climate Central, August 1st, 2012
    Climate change is a serious enough problem, but it could be a lot worse. About half of the carbon dioxide we’ve pumped into the atmosphere by burning fossil fuels has been absorbed by plants and oceans, rather than staying in circulation to drive up temperatures.

    Atmospheric CO2 Drove Climate Change During Longest Interglacial
    http://www.sciencedaily.com/releases/2012/07/120731200630.htm
    ScienceDaily, July 31, 2012
    Known as the marine isotope stage 11 (MIS 11), the interglacial period centered around 400,000 years ago was the longest and possibly the warmest interglacial in the past 0.5 million years.

    You are subscribed to email updates from Climate Code Red
    To stop receiving these emails, you mayunsubscribe now.
    Email delivery powered by Google
    Google Inc., 20 West Kinzie, Chicago IL USA 60610
  • We need to act urgently on global warming

    News 2 new results for PEAK-OIL
    National View: We need to act urgently on global warming
    SouthCoastToday.com
    Barring state intervention and environmental activism, industrial civilization will not rethink its oil addiction, any more than a shark can be talked into going vegetarian. What peak oil means is that the quest for oil will become more nasty, violent 
    See all stories on this topic »
    We need to act urgently on global warming
    The Olympian
    Back in 2009, British environmental polemicist George Monbiot warned that the peak oil disaster was upon us. But in a July 2 London Guardian column he did an about-face. “We were wrong on peak oil,” he said. “There is enough to fry us all.” While other 
    See all stories on this topic »
  • HANSEN Are we experiencing more extreme hot weather due to climate change? The evidence is in.

    climate code red


    Are we experiencing more extreme hot weather due to climate change? The evidence is in.

    Posted: 03 Aug 2012 05:06 PM PDT

    By James Hansen, Makiko Sato and Reto Ruedy (available at PDFhere)

    The greatest barrier to public recognition of human-made climate change is probably the natural variability of local climate. How can a person discern long-term climate change, given the notorious variability of local weather and climate from day to day and year to year?

    Figure 1: Fire fighters battle the Taylor Creek blaze, one of several fires which have burned over 75,000 acres in southeastern Montana in summer 2012. Image credit: USFWS/Gerald Vickers via InciWeb.org.

    The question is important because actions to stem emissions of gases that cause global warming are unlikely until the public appreciates the significance of global warming and perceives that it will have unacceptable consequences. Thus when nature seemingly provides evidence of climate change it needs to be examined objectively by the public, as well as by scientists.
    Therefore it was disappointing that most early media reports on the heat wave, widespread drought, and intense forest fires in the United States in 2012 did not mention or examine the potential connection between these climate events and global warming. Is this   reticence justified?
    In a new paper (Hansen et al., 2012a), we conclude that such reticence is not justified. The paper attempts to illustrate the data in ways that properly account for climate variability yet are understandable to the public.
    We show how the probability of unusually warm seasons is changing, emphasizing summer when the changes have large practical effects. We calculate seasonal-mean temperature anomalies relative to average temperature in the base period 1951-1980. This is an appropriate base period because global temperature was relatively stable and still within the Holocene range to which humanity and other planetary life are adapted (note 1).
    We illustrate variability of seasonal temperature in units of standard deviation (σ), including comparison with the normal distribution (“bell curve”) that the lay public may appreciate. The probability distribution (frequency of occurrence) of local summer-mean temperature anomalies was close to the normal distribution in the 1950s, 1960s and 1970s in both hemispheres (Figure 2). However, in each subsequent decade the distribution shifted toward more positive anomalies, with the positive tail (hot outliers) of the distribution shifting the most.

    Figure 2. Temperature anomaly distribution: The frequency of occurrence (vertical axis) of local temperature anomalies (relative to 1951-1980 mean) in units of local standard deviation (horizontal axis). Area under each curve is unity. Image credit: NASA/GISS.

    An important change is the emergence of a subset of the hot category, extremely hot outliers, defined as anomalies exceeding +3σ. The frequency of these extreme anomalies is about 0.13% in the normal distribution, and thus in a typical summer in the base period only 0.1-0.2% of the globe is covered by such hot extremes. However, we show that during the past several years the global land area covered by summer temperature anomalies exceeding +3σ has averaged about 10%, an increase by more than an order of magnitude compared to the base period. Recent examples of summer temperature anomalies exceeding +3σ include the heat wave and drought in Oklahoma, Texas and Mexico in 2011 and a larger region encompassing much of the Middle East, Western Asia and Eastern Europe, including Moscow, in 2010.
    The question of whether these extreme hot anomalies are a result of global warming is often answered in the negative, with an alternative interpretation based on meteorological patterns. For example, an unusual atmospheric “blocking” situation resulted in a long-lived high pressure anomaly in the Moscow region in 2010, and a strong La Niña in 2011 may have contributed to the heat and drought situation in the southern United States and Mexico. However, such meteorological patterns are not new and thus as an “explanation” fail to account for the huge increase in the area covered by extreme positive temperature anomalies. Specific meteorological patterns help explain where the high pressure regions that favor high temperature and drought conditions occur in a given summer, but the unusually great temperature extremities and the large area covered by these hot anomalies is a consequence of global warming, which is causing the bell curve to shift to the right (Fig. 2).
    Yet the distribution of seasonal temperature anomalies (Fig. 2) also reveals that a significant portion (about 15 percent) of the anomalies are still negative, corresponding to summer-mean temperatures cooler than the average 1951-1980 climate. Thus people should not be surprised by the occasional season that is unusually cool. Cool anomalies as extreme as -2σ still occur, because the anomaly distribution has broadened as well as moved to the right. In other words, our climate now encompasses greater extremes.
    Our analysis is an empirical approach that avoids use of global climate models, instead using only real world data. Theories for the cause of observed global temperature change are thus separated as an independent matter. However, it is of interest to compare the data with results from climate models that are used to simulate expected global warming due to increasing human-made greenhouse gases.
    Indeed, the “climate dice” concept was suggested in conjunction with climate simulations made in the 1980s (Hansen et al., 1988) as a way to describe the stochastic variability of local temperatures, with the implication that the public should recognize the existence of global warming once the dice become sufficiently “loaded” (biased). Specifically, the 10 warmest summers (Jun-Jul-Aug in the Northern Hemisphere) in the 30-year period (1951-1980) were used to define the “hot” summer category, the 10 coolest the “cold” category, and the middle 10 the “average” summer. Thus it was imagined that two sides of a six-sided die were colored red, blue and white for these respective categories. The divisions between “hot” and “average” and between “average” and “cold” occur at +0.43σ and -0.43σ for a normal distribution.
    Temperatures simulated in a global climate model (Hansen et al., 1988) reached a level such that four of the six sides of the climate dice were red in the first decade of the 21st century for greenhouse gas scenario B, which is an accurate approximation of actual greenhouse gas growth (Hansen and Sato 2004; updates are provided by a Columbia Univ. webpage). Observed summer temperature anomalies over global land during the past decade averaged about 75% in the “hot category”, thus midway between four and five sides of the die were red, which is reasonably consistent with expectations.
    The relation between the bell curve and climate dice is illustrated in Figure 3. Extremely hot outliers already occur more frequently than unusually cold seasons. If the march of the bell curve to the right continues unabated, within a few decades even the seasons that were once considered average will cease to occur.

    Figure 3. Frequency of occurrence (vertical axis) of local June-July-August temperature
    anomalies (relative to 1951-1980 mean) for Northern Hemisphere land in units of local standard deviation (horizontal axis). Temperature anomalies in the period 1951-1980 match closely the normal distribution (“bell curve”, shown in green), which is used to define cold (blue), typical (white) and hot (red) seasons, each with probability 33.3%. The distribution of anomalies has shifted to the right as a consequence of the global warming of the past three decades such that cool summers now cover only half of one side of a six-sided die, white covers one side, red covers four sides, and an extremely hot (red-brown) anomaly covers half of one side..

    We have shown that the increased frequency of “hot” seasons is a result of global warming. The cause of global warming is a separate matter, but observed global warming is now attributed with high confidence to increasing greenhouse gases (IPCC 2007a).
    Both attributions are important. Together they allow us to infer that the area covered by extreme hot anomalies will continue to increase in coming decades and that even more extreme outliers will occur. Indeed, we conclude that the decade-by-decade shift to the right of the temperature anomaly distribution (Fig. 2) will continue, because Earth is now out of energy balance, with more solar energy absorbed than heat radiation emitted to space (Hansen et al., 2011); it is this imbalance that drives the planet to higher temperatures. Even an exceedingly optimistic scenario for fossil fuel emissions reduction, 6%/year beginning in 2013, results in global temperature rising to almost 1.2°C relative to 1880-1920, which compares to a current level ~0.8°C (Hansen et al., 2012b).

    Figure 4. Wildfire frequency and spring-summer temperature in the western United States.
    Image credit: Westerling et al. (2006).

    Practical effects of increasingly loaded climate dice occur mainly via amplified extremes ofEarth’s water cycle. The broadening of the “bell curve” of temperature anomalies is related to interactions of warming with the water cycle. Hot summer anomalies occur when and where weather patterns yield an extended period of high atmospheric pressure. This condition is amplified by global warming and the ubiquitous surface heating due to elevated greenhouse gas levels, thus increasing the chances of an extreme anomaly. Yet global warming also increases atmospheric water vapor overall, causing, at other times or places, more extreme rainfall and floods, consistent with documented changes over Northern Hemisphere land and the tropics (IPCC 2007b).
    The (Northern Hemisphere) summer of 2012 is still unfolding. A global map of the anomaly distribution will be provided on a Columbia Univ. webpage once the data are complete; the data so far suggest that parts of the United States and Asia likely will be in the extreme (+3σ) category. One of the consequences of extreme summer heat anomalies is increased area and intensity of wildfires, as shown in Fig. 4. Updates of these data and other climate impacts after the 2012 data are complete will be useful for assessing impacts of continued global warming.

    Related Articles
    NASA News: How Warm was Summer 2010?
    NASA Earth Observatory: Image of the Day, Aug. 9, 2010: Heatwave in Russia
    NASA Earth Observatory: Image of the Day, June 29, 2012: Heat Wave Fuels Wildfires in the Rockies
    NASA Earth Observatory: Image of the Day, July 17, 2012: Drought Grips the United States

    Footnote
    1 In contrast, we infer that current global temperature is above the Holocene range, as evidenced by the fact that the ice sheets in both hemispheres are now rapidly shedding mass (Rignot et al., 2011) and sea level is rising (Nerem et al., 2006) at a rate (more than 3 mm/year or 3 m/millennium) that is much higher than the rate of sea level change during the past several millennia.

    References
    Hansen, J., I. Fung, A. Lacis, D. Rind, Lebedeff, R. Ruedy, G. Russell, and P. Stone, 1988: Global climate changes as forecast by Goddard Institute for Space Studies three-dimensional model. J. Geophys. Res., 93, 9341-9364, doi:10.1029/JD093iD08p09341.
    Hansen, J., and Mki. Sato, 2004: Greenhouse gas growth rates. Proc. Natl. Acad. Sci., 101, 16109-16114, doi:10.1073/pnas.0406982101.
    Hansen, J., Mki. Sato, P. Kharecha, and K. von Schuckmann, 2011: Earth’s energy imbalance and implications. Atmos. Chem. Phys., 11, 13421-13449, doi:10.5194/acp-11-13421-2011.
    Hansen, J., Mki. Sato, and R. Ruedy, 2012a: Perception of climate change. Proc. Natl. Acad. Sci., in press. Early draft posted as “Public perception of climate change and the new climate dice”, arXiv.org:1204.1286.
    Hansen, J., P. Kharecha, Mki. Sato, F. Ackerman, P.J. Hearty, O. Hoegh-Guldberg, S.-L. Hsu, F. Krueger, C. Parmesan, S. Rahmstorf, J. Rockstrom, E.J. Rohling, J. Sachs, P. Smith, K. Steffen, L. Van Susteren, K. von Schuckmann, and J.C. Zachos, 2012b: Scientific case for avoiding dangerous climate change to protect young people and nature. Proc. Natl. Acad. Sci., submitted.
    Intergovernmental Panel on Climate Change (IPCC), 2007a: Climate Change 2007: The Physical Science Basis. Solomon, S., et al. eds., Cambridge University Press, 996 pp.
    Intergovernmental Panel on Climate Change (IPCC), 2007b: Climate Change 2007, Impacts, Adaptation and Vulnerability. Parry, M.L., Canziani, O.F., Palutikof, J.P., Van Der Linden, P.J., and Hanson, C.E. eds., Cambridge Univ Press, 996 pp.
    Nerem, R.S., Leuliette, E., and Cazenave, A., 2006: Present-day sea-level change: A review. C. R. Geosci., 338, 1077-1083, doi:10.1016/j.crte.2006.09.001.
    Rignot, E., Velicogna, I., van den Broeke, M.R., Monaghan, A., and Lenaerts, J., 2011: Acceleration of the contribution of the Greenland and Antarctic ice sheets to sea level rise. Geophys. Res. Lett., 38, L05503, doi:10.1029/2011GL046583.
    Westerling, A.L., Hidalgo, H.G., Cayan, D.R., Swetnam, T.W., 2006: Warming and earlier spring increase western U.S. forest wildfire activity. Science, 313, 940-943, doi:10.1126/science.1128834.

    Contact
    Please address all inquiries about this research to Dr. James Hansen.

    You are subscribed to email updates from Climate Code Red
    To stop receiving these emails, you mayunsubscribe now.
    Email delivery powered by Google
    Google Inc., 20 West Kinzie, Chicago IL USA 6
  • Real battles lie within Abbott’s own camp

    Real battles lie within Abbott’s own camp

    Date
    August 4, 2012
    • 20 reading now
    • 26

    TONY Abbott and his team are living in the straitjacket of ambition. Like those (mostly) disciplined Olympic athletes, their eyes are on victory. Everything has to be tailored to winning, which means staying ”on message”, stomping around the stunt route of meat and fish markets, and managing controversial issues and restless colleagues with a minimum of headlines about splits and divisions.

    This week we have seen Abbott squaring away the internal problem of foreign investment policy and continuing to stare down the Liberal industrial relations radicals. And, if anyone cares to ask, he’ll say he’s very happy with his frontbench team, never mind that his good friend and former colleague Mal Brough, having won preselection at the weekend, is headed to Canberra with his eyes on securing a ministry ASAP.

    The opposition’s good polls and Labor’s woes mask, much of the time, the opposition’s policy and personality conflicts. The Nats, the Liberal ”dries”, periodic tensions within his own economic team, the odd party room outbreak, and keeping the Young Turks occupied all test Abbott, and would do so in government.

    The mild-mannered Warren Truss heads the Nationals but their Senate leader and wannabe future leader, Barnaby Joyce, is their spear carrier. It was Joyce who led the charge on foreign investment, being openly critical of Chinese investment by state-owned enterprises; the Nationals generally ramped up the concern about overseas designs on agricultural land.

    Free-market Liberals such as shadow treasurer Joe Hockey battled to rein in the Nats’ influence. Abbott’s confusing comments in Beijing last week, which were interpreted as being more anti-foreign investment than they were, perhaps reflected the squeeze he has been in. The discussion paper Abbott released yesterday gave ground to the Nationals by lowering the threshold for Foreign Investment Review Board examination of bids for agricultural land and agribusinesses (all those made by foreign state-owned enterprises are already scrutinised). But it retained the policy on foreign investment in other areas. Some in the Nats (whose members include both economic ”dries” and ”wets”) would have liked to go further. But they they won’t be pushing it. The Nats believe Abbott is the best Liberal leader they could have. Malcolm Turnbull wasn’t on their wavelength, and if Hockey had won the top job, he wouldn’t have been either.

    In government, things would get really interesting between the Liberals and the Nationals if Joyce, expected to move to the House of Representatives at the election, became deputy prime minister. This would not happen in the short term. But assuming Truss later retired, Joyce would probably get the numbers.

    Abbott and Joyce have more in common than a quick glance suggests. Both were educated at Sydney’s top Catholic school, Riverview, and each has been deeply influenced by Catholic social values. They are centrist, pragmatic and populist. Joyce recognises in Abbott a congenial leader; Abbott can persuade Joyce when he needs to.

    While the foreign investment policy is now more or less settled, the Coalition’s industrial relations blueprint will continue to develop until it is released. Abbott is caught between the hardline stance of business and some Liberals, and his determination to give the government minimum room to flail him. After saying that businesses would have to make the case for change, Abbott is now confronted by them shouting that case from the rooftops. If an election were called tomorrow, the Coalition’s policy would be different from the one it would have produced a year ago.

    But Abbott insists he will be cautious. The policy will promote flexibility, aim to enhance productivity, and limit what the Coalition sees as growing union militancy. But retention of the ”better off overall test (BOOT)” will be a core commitment.

    One issue will be how specific the policy is. Abbott is very aware – having watched the experience of Julia Gillard – of the cost of breaking promises, so if he says he won’t change some aspect of the IR law, he can be believed. Those wanting to push for a bigger overhaul would prefer a more general policy. ”The key thing is having enough room to do what is necessary in government to create prosperity,” one Liberal says. But everyone can play that game: Abbott will be under political pressure not to leave too many gates open. He will also have to convince business, especially small business, that there is a distinction between ”prudence” (which he promises) and ”wimpishness” (which is how they might see it) – although some business disappointment might also reassure the public that his policy is indeed cautious.

    It seems bizarre that an abundance of talent could be a problem for a leader. But this has already brought tensions – some backbenchers have been frustrated that Abbott has not been willing to shake up his frontbench – and after the election will present a dilemma. Abbott’s attitude is that reshuffles cause trouble and make enemies; he is also loyal to colleagues. The up-and-comers now reluctantly accept that, barring something unexpected, Abbott won’t change his team this side of the election. But he will have to do so, to a certain extent at least, if he wins.

    For example, the idea that Arthur Sinodinos, John Howard’s talented former chief-of-staff, would not be in the ministry – and indeed the cabinet – is ludicrous. But in what spot? Logically, finance, but Abbott has guaranteed that Andrew Robb will still hold that.

    Backbenchers such as Kelly O’Dwyer and Jamie Briggs would be looking for a post-election step up. Now, however, there are also some high-profile candidates who will walk through the parliamentary door armed with frontbench credentials – notably Brough and former West Australian treasurer Christian Porter. You would have to be a brave leader to tell Brough, who sat in John Howard’s cabinet, that he could not have an immediate and reasonable portfolio.

    Some Liberal sources think that Abbott would basically stick with his existing team, with a few unavoidable changes, and then use later opportunities to make others. But a PM is in a very strong position at the start and should go for the best possible team initially. Government is hard; all available talent is needed on its front line. Abbott would say all this is getting ahead of ourselves. His focus is on the nearer term.

    And, of course, there is the spectre of Kevin Rudd. If Labor changed leaders, and its vote jumped, Abbott would suddenly be having to manage a more nervous and critical bunch. That would be a real challenge.

    Read more: http://www.smh.com.au/opinion/political-news/real-battles-lie-within-abbotts-own-camp-20120803-23kw1.html#ixzz22X9r6vOR