|
|
“Vigilantes and saboteurs”?
|
Inbox
|
x |
|
2:25 PM (5 hours ago)
|
|
|||
|
Managing director of Ebono Institute and major sponsor of The Generator, Geoff Ebbs, is running against Kevin Rudd in the seat of Griffith at the next Federal election. By the expression on their faces in this candid shot it looks like a pretty dull campaign. Read on
|
|
|
Inbox
|
x |
|
2:25 PM (5 hours ago)
|
|
|||
|
|
|
|
|
|
![]()
|
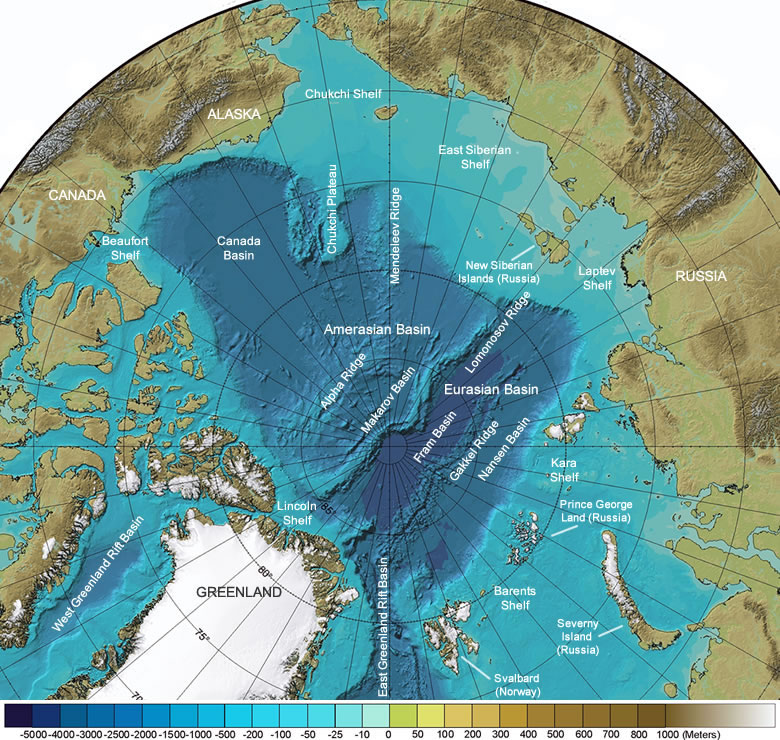
Home » Articles » Oil & Gas » Arctic Ocean Seafloor Features Map
|


A new report from global investment giant Citigroup has blown a great big hole in the Abbott government’s logic for aiming low on emissions reduction and renewable energy growth.
The Coalition’s justification for its low-ball climate targets has been, consistently, relentlessly, that it was the economically responsible policy path for the government to take. On the other hand, it argues, the costs of Labor’s “ideological obsession” – a proposed 50 per cent renewable energy target by 2030, and more ambition on emissions reduction – would be “simply catastrophic.”
Unfortunately for Tony Abbott and his environment minister Greg Hunt, the report published by Citi on Tuesday suggests this line of logic is deeply flawed.
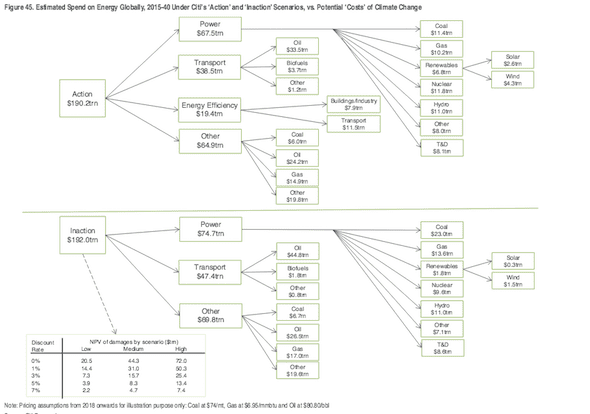
The report, which seeks to objectively analyse the economics of acting – or not – on climate change, finds that its ‘Action’ scenario – in which governments invest heavily in overhauling their energy markets, transport sectors and industries to a low-carbon mix – results in an undiscounted saving of $1.8 trillion out to 2040.
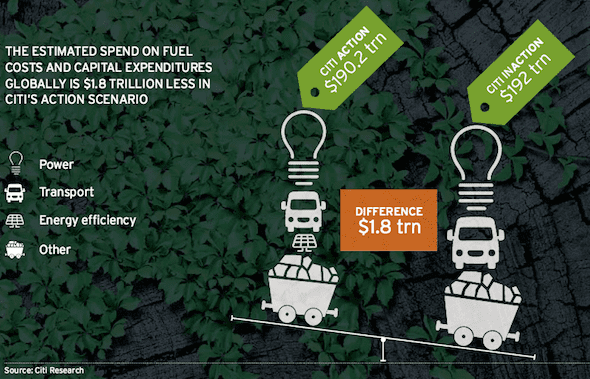
This is because, while governments spend more on renewables and energy efficiency in the early years (and yes, Citi does factor in the cost to existing industries of a massive shift to low-carbon energy sources), the savings in fuel costs in later years offset earlier investment, says the report.
Moreover, it adds, “if the scientists are correct,” – and strangely enough Citi believes they are – “the potential liabilities of not acting [listed further on in the report as global food shortages, widespread drought, mass population displacement, increased flooding, etc] are equally vast.”
“The cumulative ‘lost’ GDP from the impacts of climate change could be significant, with a central case of 0.7%-2.5% of GDP to 2060, equating to $44 trillion on an undiscounted basis,” the Citi report says.

The report finds that the cumulative losses to global GDP from climate change impacts (‘Inaction’) from 2015 to 2060 are estimated at $2 trillion to $72 trillion depending on the discount rate and scenario used. Lower discount rates encourage early action.
If emissions continue to rise and therefore temperature continues to increase after 2060, the negative effect on GDP losses could become more than 3% of GDP with estimates ranging from 1.5% to almost 5%.
More worryingly, the report notes that under an ‘Inaction’ scenario, the world would be locked to a high-emissions infrastructure and the damages could continue for more than a century, with the highest impacts of GDP foreseen in south and south-east Asia, Africa and the Middle East.
“The estimated damages could be larger as these economic studies only measure those impacts that are quantifiable and largely concentrate on market or near market sectors. Other impacts such as tipping points, weather related events or catastrophic risks are not included in the studies.”
One the other hand, says Citi, “if we derive a risk-adjusted return on the extra capital investment in following a low carbon path, and compare it to the avoided costs of climate change, we see returns at the low point of between 1% and 4%, rising to between 3% and 10% in later years.”
So, on a risk adjusted basis this implies a return of 1-4 per cent at the low point in 2021, rising to between 3-10 per cent by 2035, the report finds.
“Not spectacular returns,” Citi concedes, “but against current low yields… it represents a relatively attractive option.” And, of course, there is the added benefit of avoiding catastrophic global warming.
Summing up, the Citi report has this to say: “With a limited differential in the total bill of Action vs Inaction (in fact a saving on an undiscounted basis), potentially enormous liabilities avoided and the simple fact that cleaner air must be preferable to pollution, a very strong ‘Why would you not?’ argument regarding action on climate change begins to form.”
Can someone let Abbott know?
geology McAfee SECURE sites help keep you safe from identity theft, credit card fraud, spyware, spam, viruses and online scams
Geology.com News Rocks Minerals Gemstones Articles Dictionary US Maps World Maps Geology Store
Advertising
Categories
Astronomy
Careers
Diamonds
Earthquakes
Energy
Fossils
Gemstones
General Geology
Geologic Hazards
Geologist Information
Geology Tools
Gold
Igneous Rocks
Landslides
Metals
Metamorphic Rocks
Meteorites
Minerals
Oceanography
Oil and Gas
Plate Tectonics
Rocks
Rock Tumblers
Satellite Images
Sedimentary Rocks
Teacher Resources
U.S.A. Maps
Volcanoes
World Maps
World Records
From Our Store
All Products
Field Books
Fossil Fish
Gem & Mineral Books
Gfeller Leather Cases
Gold Books & Maps
Rock Hammers
Rock & Mineral Kits
Roadside Geology Guides
Topographic Maps
Tumbled Stones
Wall Maps
Waterproof Paper
Map Collections
Alabama Map
Alaska Map
Arizona Map
Arkansas Map
California Map
Colorado Map
Connecticut Map
Delaware Map
Florida Map
Georgia Map
Hawaii Map
Idaho Map
Illinois Map
Indiana Map
Iowa Map
Kansas Map
Kentucky Map
Louisiana Map
Maine Map
Maryland Map
Massachusetts Map
Michigan Map
Minnesota Map
Mississippi Map
Missouri Map
Montana Map
Nebraska Map
Nevada Map
New Hampshire Map
New Jersey Map
New Mexico Map
New York Map
North Carolina Map
North Dakota Map
Ohio Map
Oklahoma Map
Oregon Map
Pennsylvania Map
Rhode Island Map
South Carolina Map
South Dakota Map
Tennessee Map
Texas Map
Utah Map
Vermont Map
Virginia Map
Washington Map
West Virginia Map
Wisconsin Map
Wyoming Map
Home » Articles » REE – Rare Earth Elements
REE – Rare Earth Elements and their Uses
The demand for rare earth elements has grown rapidly, but their occurrence in minable deposits is limited.
Rare Earth Element Production
This chart shows a history of rare earth element production, in metric tons of rare earth oxide equivalent, between 1950 and 2013. It clearly shows the United States’ entry into the market in the mid-1960s when color television exploded the demand. When China began selling rare earths at very low prices in the late-1980s, mines in the USA cut production and then went inactive in the late 1990s. When China cut exports in 2010, rare earth prices skyrocketed. That motivated new production in the United States and other countries.
What Are Rare Earth Elements (REEs)?
Rare earth elements are a group of seventeen chemical elements that occur together in the periodic table (see image at right). The group consists of yttrium and the 15 lanthanide elements (lanthanum, cerium, praseodymium, neodymium, promethium, samarium, europium, gadolinium, terbium, dysprosium, holmium, erbium, thulium, ytterbium, and lutetium). Scandium is found in most rare earth element deposits and is sometimes classified as a rare earth element. The International Union of Pure and Applied Chemistry includes scandium in their rare earth element definition.
The rare earth elements are all metals, and the group is often referred to as the “rare earth metals.” These metals have many similar properties and that often causes them to be found together in geologic deposits. They are also referred to as “rare earth oxides” because many of them are typically sold as oxide compounds.
Uses of Rare Earth Elements
Rare earth metals and alloys that contain them are used in many devices that people use every day such as computer memory, DVDs, rechargeable batteries, cell phones, catalytic converters, magnets, fluorescent lighting and much more.
During the past twenty years, there has been an explosion in demand for many items that require rare earth metals. Twenty years ago there were very few cell phones in use, but the number has risen to over 7 billion in use today. The use of rare earth elements in computers has grown almost as fast as cell phones.
United States Usage
(2013 data from USGS)
Chemical catalysts
65%
Metallurgy & alloys
19%
Glass polishing
6%
Permanent magnets
9%
Other
1%
Many rechargeable batteries are made with rare earth compounds. Demand for the batteries is being driven by demand for portable electronic devices such as cell phones, readers, portable computers, and cameras.
Several pounds of rare earth compounds are in batteries that power every electric vehicle and hybrid-electric vehicle. As concerns for energy independence, climate change and other issues drive the sale of electric and hybrid vehicles, the demand for batteries made with rare earth compounds will climb even faster.
Rare earths are used as catalysts, phosphors, and polishing compounds. These are used for air pollution control, illuminated screens on electronic devices, and the polishing of optical-quality glass. All of these products are expected to experience rising demand.
Other substances can be substituted for rare earth elements in their most important uses; however, these substitutes are usually less effective and costly.
From the 1950s until the early 2000s, cerium oxide was a very popular lapidary polish. It was inexpensive and very effective. The recent price increases have almost eliminated the use of cerium oxide in rock tumbling and the lapidary arts. Other types of polish, such as aluminum and titanium oxide, are now used in its place.
Critical Defense Uses
Rare earth elements play an essential role in our national defense. The military uses night-vision goggles, precision-guided weapons, communications equipment, GPS equipment, batteries and other defense electronics. These give the United States military an enormous advantage. Rare earth metals are key ingredients for making the very hard alloys used in armored vehicles and projectiles that shatter upon impact.
Substitutes can be used for rare earth elements in some defense applications; however, those subsitutes are usually not as effective and that diminishes military superiority. Several uses of rare earth elements are summarized in the table below (5).
Defense Uses of Rare Earth Elements
Lanthanum night-vision goggles
Neodymium laser range-finders, guidance systems, communications
Europium fluorescents and phosphors in lamps and monitors
Erbium amplifiers in fiber-optic data transmission
Samarium permanent magnets that are stable at high temperatures
Samarium precision-guided weapons
Samarium “white noise” production in stealth technology
Are These Elements Really “Rare”?
Rare earth elements are not as “rare” as their name implies. Thulium and lutetium are the two least abundant rare earth elements – but they each have an average crustal abundance that is nearly 200 times greater than the crustal abundance of gold (1). However, these metals are very difficult to mine because it is unusual to find them in concentrations high enough for economical extraction.
The most abundant rare earth elements are cerium, yttrium, lanthanum and neodymium (2). They have average crustal abundances that are similar to commonly used industrial metals such as chromium, nickel, zinc, molybdenum, tin, tungsten and lead (1). Again, they are rarely found in extractable concentrations.
History of Rare Earth Production and Trade
Pre-1965
Before 1965 there was relatively little demand for rare earth elements. At that time, most of the world’s supply was being produced from placer deposits in India and Brazil. In the 1950s, South Africa became the leading producer from rare earth bearing monazite deposits. At that time, the Mountain Pass Mine in California was producing minor amounts of rare earth oxides from a Precambrian carbonatite.
Color Television Ignites Demand
The demand for rare earth elements saw its first explosion in the mid-1960s, as the first color television sets were entering the market. Europium was the essential material for producing the color images. The Mountain Pass Mine began producing europium from bastnasite, which contained about 0.1% europium. This effort made the Mountain Pass Mine the largest rare earth producer in the world and placed the United States as the leading producer.
China Enters the Market
China began producing noteable amounts of rare earth oxides in the early 1980s and became the world’s leading producer in the early 1990s. Through the 1990s and early 2000s, China steadily strengthened its hold on the world’s rare earth oxide market. They were selling rare earths at such low prices that the Mountain Pass Mine and many others throughout the world were unable to compete and stopped operation.
Defense and Consumer Electronics Demand
At the same time, world demand was skyrocketing as rare earth metals were designed into a wide variety of defense, aviation, industrial and consumer electronics products. China capitalized on its dominant position and began restricting exports and allowing rare earth oxide prices to rise to historic levels.
China as the Largest Rare Earth Consumer
In addition to being the world’s largest producer of rare earth materials, China is also the dominant consumer. They use rare earths mainly in manufacturing electronics products for domestic and export markets. Japan and the United States are the second and third largest consumers of rare earth materials. It is possible that China’s reluctance to sell rare earths is a defense of their value-added manufacturing sector.
China’s Apex of Production Dominance?
The Chinese dominance may have peaked in 2010 when they controlled about 95% of the world’s rare earth production and prices for many rare earth oxides had risen over 500% in just a few years. That was an awakening for rare earth consumers and miners throughout the world. Mining companies in the United States, Australia, Canada and other countries began to reevaluate old rare earth prospects and explore for new ones.
High prices also caused manufacturers to do three things: 1) seek ways to reduce the amount of rare earth elements needed to produce each of their products; 2) seek alternative materials to use in place of rare earth elements; and, 3) develop alternative products that do not require rare earth elements.
This effort has resulted in a decline in the amounts of rare earth materials used in some types of magnets and a shift from rare earth lighting products to light-emitting diode technology. In the United States, the average consumption of rare earths per unit of manufactured product has decreased but the demand for more products manufactured with rare earth elements has increased. The result has been higher consumption.
China Buying Resources Outside of China
Chinese companies have been purchasing rare earth resources in other countries. In 2009 China Non-Ferrous Metal Mining Company bought a majority stake in Lynas Corporation, an Australian company that has one of the highest outputs of rare earth elements outside of China. They also purchased the Baluba Mine in Zambia.
Rare Earth Production Outside of China
Mines in Australia began producing rare earth oxides in 2011. In 2012 and 2013 they were supplying about 2% to 3% of world production. In 2012, the Mountain Pass Mine came back into production and the United States produced about 4% of the world’s rare earth elements in 2013. India has been producing about 3% of the world’s supply for the past decade. Indonesia, Russia, Nigeria, North Korea, Malaysia, and Vietnam are minor producers [3].
As of 2013 rare earth assessments were underway in Australia, Brazil, Canada, China, Finland, Greenland, India, Kyrgyzstan, Madagascar, Malawi, Mozambique, South Africa, Sweden, Tanzania, Turkey, and Vietnam [2]. Some of these might result in additional production.
The United States Geological Survey estimates that although China is the world-leader in rare earth production they only control about 50% of the world’s reserves. This provides an opportunity for other countries to become important producers now that China is not selling rare earth materials below the cost of production.
Dangers of a Dominant World Producer
Supply and demand normally determine the market price of a commodity. As supplies shrink, prices go up. As prices go higher, those who control the supply are tempted to sell. Mining companies see high prices as an opportunity and attempt to develop new sources of supply.
With rare earth elements, the time between a mining company’s decision to acquire a property and the start of production can be several years or longer. There is no fast way to open a new mining property.
If a single country controls almost all of the production and makes a firm decision not to export, then the entire supply of a commodity can be quickly cut off. That is a dangerous situation when new sources of supply take so long to develop.
In 2010 China significantly restricted their rare earth exports. That was done to ensure a supply of rare earths for domestic manufacturing and for environmental reasons. This shift by China triggered panic buying and some rare earth prices shot up exponentially. In addition, Japan, the United States, and the European Union complained to the World Trade Organization about China’s restrictive rare earth trade policies.
World Rare Earth Mineral Resources
“Rare earths are relatively abundant in the Earth’s crust, but discovered minable concentrations are less common than for most other ores. U.S. and world resources are contained primarily in bastnäsite and monazite. Bastnäsite deposits in China and the United States constitute the largest percentage of the world’s rare-earth economic resources, while monazite deposits in Australia, Brazil, China, India, Malaysia, South Africa, Sri Lanka, Thailand, and the United States constitute the second largest segment.
Apatite, cheralite, eudialyte, loparite, phosphorites, rare-earth-bearing (ion adsorption) clays, secondary monazite, spent uranium solutions, and xenotime make up most of the remaining resources. Undiscovered resources are thought to be very large relative to expected demand.” Quoted from the United States Geological Survey’s Mineral Commodity Summary (2).
Rare Earth Element Outlook
The global demand for automobiles, consumer electronics, energy-efficient lighting, and catalysts is expected to rise rapidly over the next decade. Rare earth magnet demand is expected to increase, as is the demand for rechargeable batteries. New developments in medical technology are expected to increase the use of surgical lasers, magnetic resonance imaging, and positron emission tomography scintillation detectors.
Rare earth elements are heavily used in all of these industries, so the demand for them should remain high.
Contributor: Hobart King
|
|
|
Inbox
|
x |

|
3:41 PM (3 minutes ago)
|
|
|||
In shocking whistleblower revelations last night, ten foreign multinationals shifted $31 billion in revenue in one year to dodge Australian tax.1
Among the worst of the corporate tax dodgers are the dirty old energy companies.
These big polluters pay nothing on their carbon pollution emissions and receive enormous government handouts – a whopping $1,712 from every Australian.2 All the while, they’re shipping billions in Australian profits to overseas investors, with little to no tax paid into our economy to help fund our public schools and hospitals.
Well, their day of reckoning is coming with a Senate inquiry likely kicking off next week. But there’s a catch: if no one’s paying attention, it tells our politicians we don’t care and gives them little incentive to take action. These companies could walk away scot-free, while ordinary Australian taxpayers are left to pick up the bill.
So to show the Abbott Government we mean business, we’re doing an Australian first: placing the biggest ad possible in a major newspaper to draw attention to these critical Senate hearings. (We’re checking ad prices now and need to book soon.)
Here’s some of the dirty details we know already. Shell service stations paid $0 tax on $60 billion in Australian revenue over the past three years.3 And a group of multinationals, including Chevron, ExxonMobil and Shell, have allegedly arranged to extract $60 billion in tax free profits from the massive Gorgon gas project.4
Then, last night’s Channel 7 exclusive revealed that:
Last time we checked, Australian workers don’t get to ship their wages to overseas tax havens to avoid paying tax. Yet Treasurer Joe Hockey is hinting at GST hikes for everyday Australians, proving that when multinational corporations don’t pay their dues, we pay the price.
Mr Hockey can’t dodge immense public pressure to deal with corporate tax dodgers, but it all depends on how much we can crank up the volume on these Senate hearings. Let’s make sure that all eyes are on the tax dodging of the dirtiest energy companies next week.
Thanks for speaking out,
Daney, Mark, Nat and Alycia, for the GetUp team
PS – Today, the Senate committee investigating corporate tax dodgers handed down a damning interim report. The report included some key recommendations that would force more transparency on these companies and give regulators new powers to crack down on corporate tax dodging. Whether these recommendations get up will depend on how much pressure the Abbott Government feels to finally do something. If each of us chips in a small amount today, we can shine a big spotlight on the actions of tax dodging fossil fuel companies next week – but we need to act quickly to get the ad space booked. Click here to chip in
References
[1] Exclusive: $31 bn sent offshore to avoid tax, Sunday Night, Channel Seven, 16 August 2015
[2] G20 countries pay over $1000 per citizen in fossil fuel subsidies, The Guardian, 4 August 2015
[3] Shell pumped $20 billion a year from motorists but paid no tax, Sydney Morning Herald, 9 August 2015
[4] ATO looks into Chevron, ExxonMobil and Shell’s $60 bn tax-free windfall, Australian Financial Review, 17 August 2015
[5] Exclusive: Corporate tax dodge, Sunday Night, Channel Seven, 16 August 2015
|
Inbox
|
x |
|
 9:40 PM (5 minutes ago) 9:40 PM (5 minutes ago)
|
|
|||