Category: Uncategorized

  • Paleoclimate: The End of the Holocene

    RealClimate logo


    Technical Note: We have changed the contact email for the blog to reduce the amount of unsolicited email. If you want to contact us at the blog, please use contact-at-realclimate.org.

    Paleoclimate: The End of the Holocene

    Filed under:

    — stefan @ 16 September 2013 – (Deutsch)

    Recently a group of researchers from Harvard and Oregon State University has published the first global temperature reconstruction for the last 11,000 years – that’s the whole Holocene (Marcott et al. 2013). The results are striking and worthy of further discussion, after the authors have already commented on their results in this blog.
    A while ago, I discussed here the new, comprehensive climate reconstruction from the PAGES 2k project for the past 2000 years. But what came before that? Does the long-term cooling trend that ruled most of the last two millennia reach even further back into the past?

    Over the last decades, numerous researchers have painstakingly collected, analyzed, dated, and calibrated many data series that allow us to reconstruct climate before the age of direct measurements. Such data come e.g. from sediment drilling in the deep sea, from corals, ice cores and other sources. Shaun Marcott and colleagues for the first time assembled 73 such data sets from around the world into a global temperature reconstruction for the Holocene, published in Science. Or strictly speaking, many such reconstructions: they have tried about twenty different averaging methods and also carried out 1,000 Monte Carlo simulations with random errors added to the dating of the individual data series to demonstrate the robustness of their results.

    To show the main result straight away, it looks like this:

    Marcott
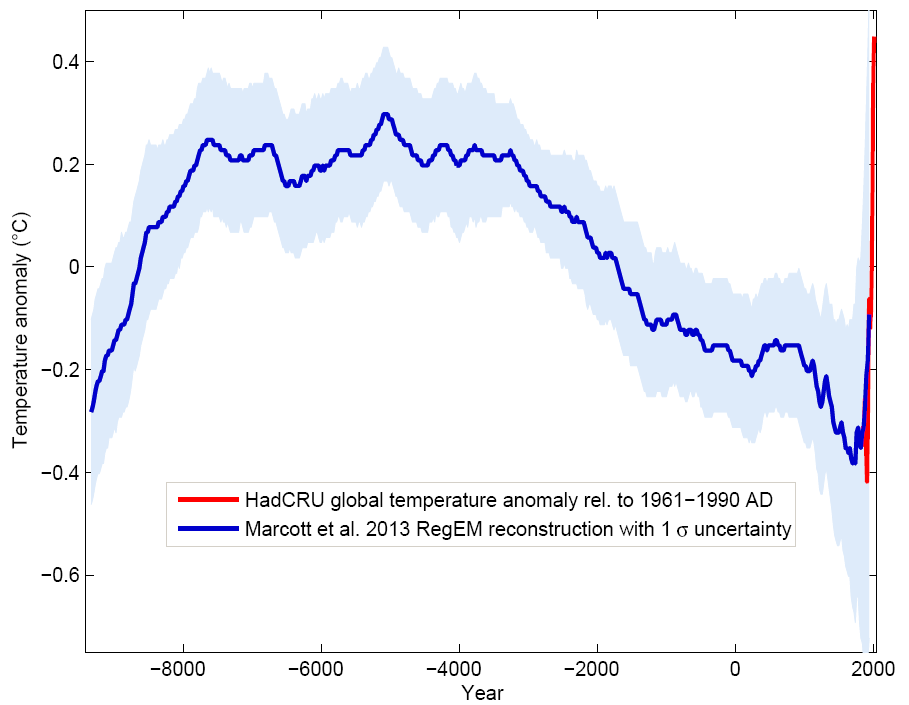
    Figure 1 Blue curve: Global temperature reconstruction from proxy data of Marcott et al, Science 2013. Shown here is the RegEM version – significant differences between the variants with different averaging methods arise only towards the end, where the number of proxy series decreases. This does not matter since the recent temperature evolution is well known from instrumental measurements, shown in red (global temperature from the instrumental HadCRU data). Graph: Klaus Bitterman.

    The climate curve looks like a “hump”. At the beginning of the Holocene – after the end of the last Ice Age – global temperature increased, and subsequently it decreased again by 0.7 ° C over the past 5000 years. The well-known transition from the relatively warm Medieval into the “little ice age” turns out to be part of a much longer-term cooling, which ended abruptly with the rapid warming of the 20th Century. Within a hundred years, the cooling of the previous 5000 years was undone. (One result of this is, for example, that the famous iceman ‘Ötzi’, who disappeared under ice 5000 years ago, reappeared in 1991.)

    The shape of the curve is probably not surprising to climate scientists as it fits with the forcing due to orbital cycles. Marcott et al. illustrate the orbital forcing with this graphic:

    marcott_fig_2
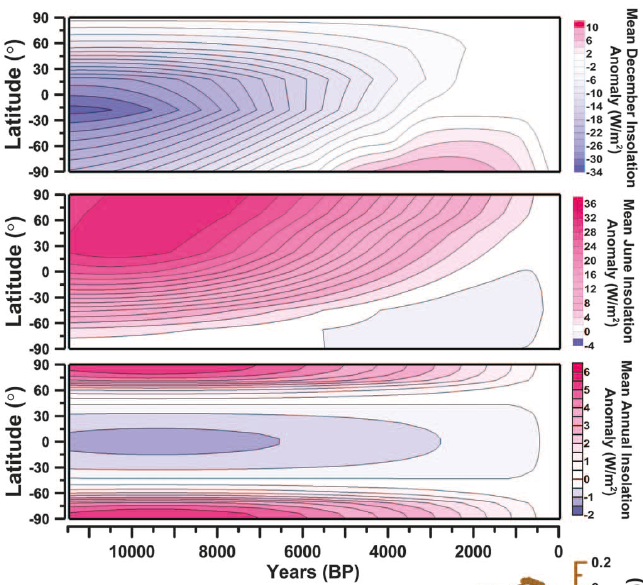
    Figure 2 Changes in incoming solar radiation as a function of latitude in December, January and annual average, due to the astronomical Milankovitch cycles (known as orbital forcing). Source: Marcott et al., 2013.

    In the bottom panel we see the sunlight averaged over the year, as it depends on time and latitude. It declined strongly in the mid to high latitudes over the Holocene, but increased slightly in the tropics. In the Marcott reconstruction the global temperature curve is dominated primarily by the large temperature changes in northern latitudes (30-90 °N). For this, the middle panel is particularly relevant: the summer maximum of the incoming radiation. That reduces massively during the Holocene – by more than 30 watts per square meter. (For comparison: the anthropogenic carbon dioxide in the atmosphere produces a radiative forcing of about 2 watts per square meter – albeit globally and throughout the year.) The climate system is particularly sensitive to this summer insolation, because it is amplified by the snow- and ice-albedo feedback. That is why in the Milanković theory summer insolation is the determining factor for the ice age cycles – the strong radiation maximum at the beginning of the Holocene is the reason why the ice masses of the last Ice Age disappeared.

    However a puzzle remains: climate models don’t seem to get this cooling trend over the last 5,000 years. Maybe they are underestimating the feedbacks that amplify the northern orbital forcing shown in Fig. 2. Or maybe the proxy data do not properly represent the annual mean temperature but have a summer bias – as Fig. 2 shows, it is in summer that the solar radiation has declined so strongly since the mid-Holocene. As Gavin has just explained very nicely: a model-data mismatch is an opportunity to learn something new, but it takes work to find out what it is.

    Comparison with the PAGES 2k reconstruction

    The data used by Marcott et al. are different from those of the PAGES 2k project (which used land data only) mainly in that they come to 80% from deep-sea sediments. Sediments reach further back in time (far further than just through the Holocene – but that’s another story). Unlike tree-ring data, which are mainly suitable for the last two thousand years and rarely reach further. However, the sediment data have poorer time resolution and do not extend right up to the present, because the surface of the sediment is disturbed when the sediment core is taken. The methods of temperature reconstruction are very different from those used with the land data. For example, in sediment data the concentration of oxygen isotopes or the ratio of magnesium to calcium in the calcite shells of microscopic plankton are used, both of which show a good correlation with the water temperature. Thus each sediment core can be individually calibrated to obtain a temperature time series for each location.

    Overall, the new Marcott reconstruction is largely independent of, and nicely complementary to, the PAGES 2k reconstruction: ocean instead of land, completely different methodology. Therefore, a comparison between the two is interesting:
    Marcott_PAGES2k
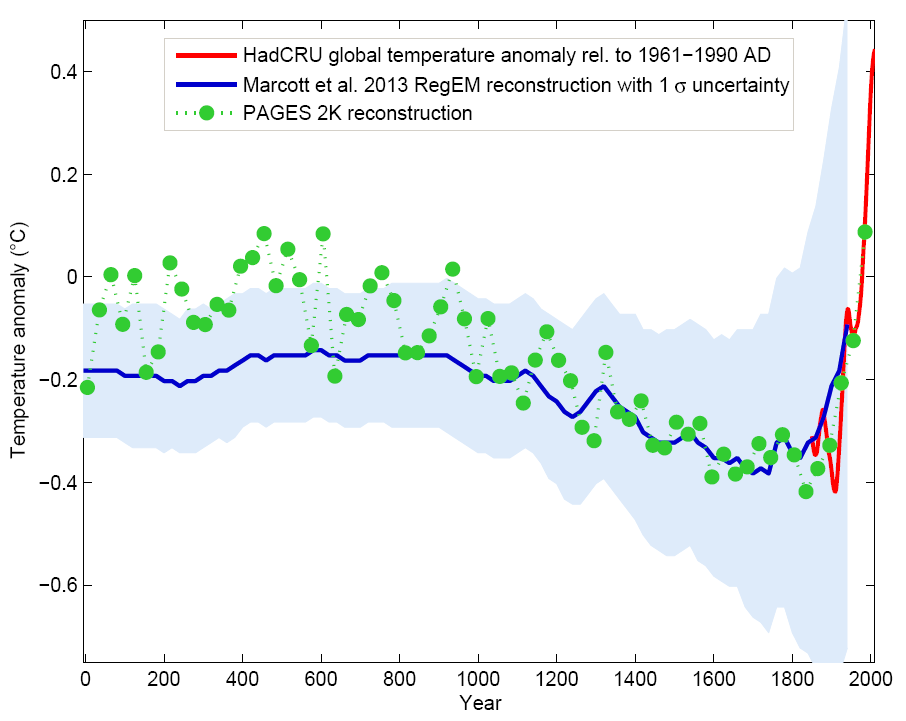
    Figure 3 The last two thousand years from Figure 1, in comparison to the PAGES 2k reconstruction (green), which was recently described here in detail. Graph: Klaus Bitterman.

    As we can see, both reconstruction methods give consistent results. That the evolution of the last one thousand years is virtually identical is, by the way, yet another confirmation of the “hockey stick” by Mann et al. 1999, which is practically identical as well (see graph in my PAGES article).

    Is the modern warming unique?

    Because of the above-mentioned limitations of sediment cores, the new reconstruction does not reach the present but only goes to 1940, and the number of data curves used already strongly declines before that. (Hence we see the uncertainty range getting wider towards the end and the reconstructions with different averaging methods diverge there – we here show the RegEM method because it deals best with the decreasing data coverage. For a detailed analysis see the article by statistician Grant Foster.) The warming of the 20th Century can only be seen partially – but this is not serious, because this warming is very well documented by weather stations anyway. There can be no doubt about the climatic warming during the 20th Century.

    There is a degree of flexibility on how the proxy data (blue) should be joined with the thermometer data (red) – here I’ve done this so that for the period 1000 to 1940 AD the average temperature of the Marcott curve and the PAGES 2k reconstruction are equal. I think this is better than the choice of Marcott et al. (whose paper was published before PAGES 2k) – but this is not important. The relative positioning of the curves makes a difference for whether the temperatures are slightly higher at the end than ever before in the Holocene, or only (as Marcott et al write) higher than during 85% of the Holocene. Let us just say they are roughly as high as during the Holocene optimum: maybe slightly cooler, maybe slightly warmer. This is not critical.

    The important point is that the rapid rise in the 20th Century is unique throughout the Holocene. Whether this really is true has been intensively discussed in the blogs after the publication of the Marcott paper. Because the proxy data have only a coarse time resolution – would they have shown it if there had been a similarly rapid warming earlier in the Holocene?

    I think for three reasons it is extremely likely that there was not such a rapid warming before:

    1. There are a number of high-resolution proxy data series over the Holocene, none of which suggest that there was a previous warming spike as strong as in the 20th Century. Had there been such a global warming before, it would very likely have registered clearly in some of these data series, even if it didn’t show up in the averaged Marcott curve.

    2. Grant Foster performed the test and hid some “20th C style” heating spikes in earlier parts of the proxy data to see whether they are revealed by the method of Marcott et al – the answer is a resounding yes, they would show up (albeit attenuated) in the averaged curve, see his article if you are interested in the details.

    3. Such heating must have a physical basis, and it would have to have quickly disappeared again (would it have lasted, it would be even more evident in the proxy data). There is no evidence in the forcing data that such a climate forcing could have suddenly appeared and disappeared, and I cannot imagine what could have been the mechanism. (A CO2-induced warming would persist until the CO2 concentration decays again over thousands of years – and of course we have good data on the concentration of CO2 and other greenhouse gases for the whole Holocene.)

    Conclusion

    The curve (or better curves) of Marcott et al. will not be the last word on the global temperature history during the Holocene; like Mann et al. in 1998 it is the opening of the scientific discussion. There will certainly be alternative proposals, and here and there some corrections and improvements. However, I believe that (as was the case with Mann et al. for the last millennium) the basic shape will turn out to be robust: a relatively smooth curve with slow cooling trend lasting millennia from the Holocene optimum to the “little ice age”, mainly driven by the orbital cycles. At the end this cooling trend is abruptly reversed by the modern anthropogenic warming.

    The following graph shows the Marcott reconstruction complemented by some context: the warming at the end of the last Ice Age (which 20,000 years ago reached its peak) and a medium projection for the expected warming in the 21st Century if humanity does not quickly reduce greenhouse gas emissions.

    shakun_marcott_hadcrut4_a1b_eng
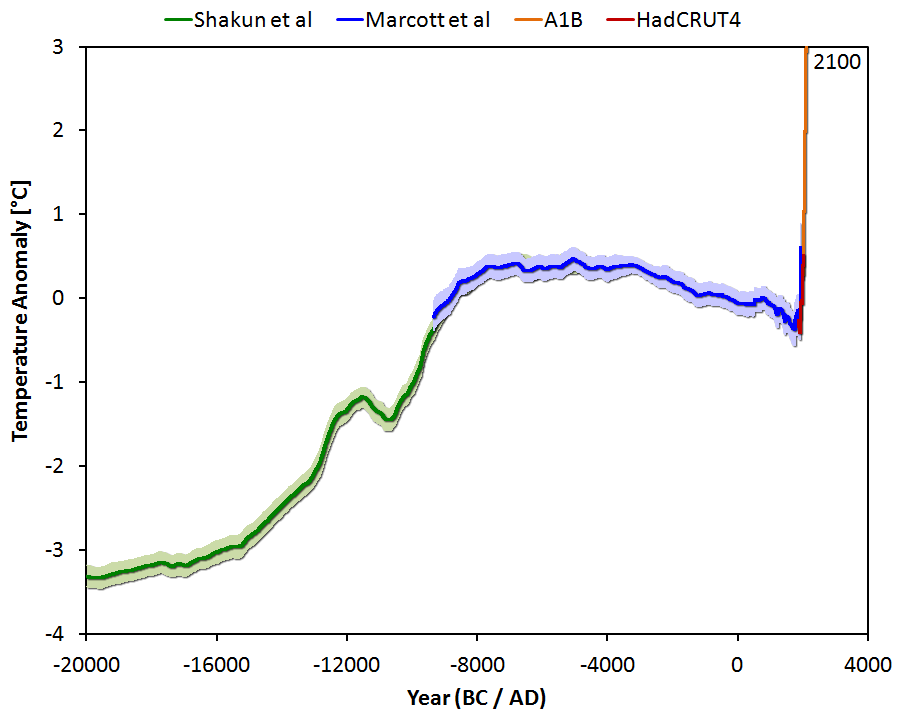
    Figure 4 Global temperature variation since the last ice age 20,000 years ago, extended until 2100 for a medium emissions scenario with about 3 degrees of global warming. Graph: Jos Hagelaars.

    Marcott et al. dryly state about this future prospect:

    By 2100, global average temperatures will probably be 5 to 12 standard deviations above the Holocene temperature mean.

    In other words: We are catapulting ourselves way out of the Holocene.

    Just looking at the known drivers (climate forcings) and the actual temperature history shows it directly, without need for a climate model: without the increase in greenhouse gases caused by humans, the slow cooling trend would have continued. Thus virtually the entire warming of the 20th Century is due to man. This May, for the first time in at least a million years, the concentration of carbon dioxide in our atmosphere has exceeded the threshold of 400 ppm.

  • Natural Gas May Be Easier On Climate Than Coal, Despite Methane Leaks

    Energy
    4:55 pm
    Mon September 16, 2013

    Natural Gas May Be Easier On Climate Than Coal, Despite Methane Leaks

    Credit Brennan Linsley / AP
    A rig drills a hydraulic fracturing well for natural gas outside Rifle, Colo., in March.

    Originally published on Mon September 16, 2013 6:11 pm

    From the standpoint of global warming, burning natural gas can be better than burning coal, a study published this week suggests.

    This is a contentious issue among people who are opposed to the natural gas drilling practice known as fracking. That technique involves injecting water, sand and chemicals into wells to release far more gas than conventional drilling can. Opponents of fracking have been concerned not only about local environmental issues, but also about the potential for methane leaks to make global warming worse.

    Even though natural gas burns much cleaner than coal, the main constituent, methane, also leaks into the atmosphere during production. Methane is a potent greenhouse gas, so those leaks could potentially wipe out the climate benefits of natural gas.

    And fracking technology took off before anyone really understood how much natural gas leaks out in the process.

    “We wanted to go out and collect some of the first data on some of the new types of operations underway in natural gas production and what the methane emissions are,” says David Allen, an engineering professor at the University of Texas in Austin.

    Allen got funding from the Environmental Defense Fund, as well as support from nine major companies that volunteered to participate in the study. His conclusion: Currently the U.S. Environmental Protection Agency greatly overestimates methane emissions from a new well that is being prepared to produce gas for the first time. But he found that the EPA also greatly underestimates emissions from wells that are already in production. And when you add the whole thing up, it’s basically a wash, Allen says.

    That’s potentially good news for advocates of natural gas, because it supports the argument that, if done right, natural gas production can be much better for the climate than coal.

    The study appears in the Proceedings of the National Academy of Sciences, and suggests ways to make the production of natural gas cleaner than it is today.

    For example, it turns out there’s a lot of methane leakage from fracking operations that separate natural gas from oil and water as they come up the well at the same time.

    “That was the biggest surprise for me, as an operator,” says Edwin Hance from Pioneer Natural Resources, a natural gas company that operates mostly in Texas and participated in the study.

    “I would say that’s the primary area we need to focus going forward,” Hance says, “as far as practices where we can have the opportunity to reduce emissions further.”

    It’s important to note that the study relied on data from nine companies, all of which volunteered to be studied. Bob Howarth, a professor of ecology and environmental biology at Cornell University, says that means the results from the 190 study sites are not necessarily representative of the industry as a whole.

    “I would view this as best-case scenario for what industry can do to reduce methane emissions when they want to,” Howarth says.

    A different study, published last month by the National Oceanic and Atmospheric Administration, may be more representative of a worst-case scenario. The NOAA study sampled the air in an entire basin in Utah, rather than tracking emissions down to specific pieces of equipment and specific practices.

    “They’re finding methane emissions that are 10 to 20 times higher than this new study,” Howarth says, “and I think [that’s] probably more representative of at least those western gas fields, when industry does not realize it’s being watched.”

    Figuring out what practices are responsible for large methane emissions, like those in Utah, will take more work.

    Steve Hamburg, chief scientist at the Environmental Defense Fund, says his organization is funding 16 studies to look at the entire natural gas system in the United States. The PNAS study, focusing only on production, is just one part of that.

    “Regrettably, we need another year, and then we’ll have all of these pieces together and we really can get a much clearer picture of what’s going on,” Hamburg says.

    At stake isn’t simply gas production in the United States. Natural gas is taking off globally. So Hamburg says these measurements offer producers and regulators an opportunity to fix what’s wrong in the U.S. and to spread those best practices around

  • Australia, where is your science minister?

    Australia, where is your science minister?

    Tony Abbott’s front bench team will not have a science minister – instead, science will come under the industry minister’s portfolio. The doesn’t bode well for climate change

    Australia's prime minister-elect Tony Abbott announcing his incoming cabinet in Canberra on 16 September 2013.
    Australia’s prime minister-elect Tony Abbott announcing his incoming cabinet in Canberra on 16 September 2013. Photograph: Mark Graham/AFP/Getty

    Climate change has become a political football in Australia in a game with few rules and, depending on your chosen sporting code, plenty of illegal spear tackling and studs-up challenges.

    To continue with our sporting analogy, Australia’s prime minister elect Tony Abbott has just taken the climate change ball and locked it in a cupboard at the back of the official residence. And in the same cupboard, there’s a fancy-looking box with the word “science” written on it (there is some awesome stuff in there, including iPhones, advances in agriculture and the occasional medical breakthrough).

    Abbott’s first cabinet, announced yesterday, has a front bench team comprised of ministers for defence, immigration and border protection, the arts, agriculture, health and sport and small business, among others. Yet there will be no minister for science. Abbott suggested to reporters this would come under the portfolio of Ian Macfarlane, who was yesterday named minister for industry. In opposition, Greg Hunt’s position was the shadow minister for climate action, environment and heritage. Abbott has taken his eraser to Hunt’s title, rubbing out the words “climate action” and “heritage”.

    Science didn’t exactly stick out like a Higgs Boson in the previous government’s ministry either. Senator Kim Carr was officially the minister for innovation, industry, science and research in a department with a name so long it could be barely uttered in a single breath (OK – I exaggerate, it was the department of industry, innovation, climate change, science, research and tertiary education).

    One Liberal MP disappointed with the lack of a science portfolio would be the member for Tangney, Dennis Jensen, who told the media last week he was the right person for the job-that-wasn’t. Jensen also had a few thoughts about climate change and my questions to him about his partial-endorsement of climate sceptic Lord Christopher Monckton remain unanswered.

    Jensen won’t be alone in bemoaning the lack of an obvious portfolio for science. Around 68,000 “scientists and technologists” are also scratching their heads waiting for answers, according to Catriona Jackson, the chief executive of Science & Technology Australia, the body which represents them.

    She said earlier: “Scientists around the nation are asking, where is the science minister?’” She told me the nation’s scientists would be “confused and disappointed” by the absence of an obvious ministerial position to represent a sector which, she said, was “at the heart of everything that government does”. She added that Abbott’s plans for science will be clearer when the detailed administrative arrangements are released “any day now”, but we might presume Macfarlane’s portfolio will also include energy (another key word missing from the list of titles), giving the new industry minister a role very similar to that which he played under the government of John Howard.

    Back in 2006, Macfarlane was named by academic, author and public intellectual Clive Hamilton as being amongst a “dirty dozen” of Australians characterised as the “greenhouse mafia” who had worked harder than any others to “prevent any effective action to reduce Australia’s burgeoning greenhouse gas emissions”. In an interview with the ABC in 2007, Macfarlane was pressed on his views about human-caused climate change and was unconvincing in his response.

    Thankfully since then, the implications for policy makers from the science on human-caused climate change have become clearer (not that they weren’t clear back then). It’s happening, it’s us and we should take it really seriously. The fossil fuel industry will be hoping that Macfarlane’s views haven’t changed.

    Hunt has always insisted that human-caused climate change is a serious issue. Now he just needs to go and ask the boss if he can get the ball out of the cupboard and do something meaningful with it. The signs are not good.

  • Facts about Thorium

    thoriumAtomic Number: 90
    Atomic Symbol: Th
    Atomic Weight: 232
    Melting Point: 3,182 F (1,750 C)
    Boiling Point: 8,650 F (4,788 C)

    Word origin: Thorium is named for Thor, the Norse god of thunder.

    Discovery: Thorium was discovered as an element in 1928 by Swedish chemist Jons Jakob Berzelius. Berzelius received a sample of an unidentified black mineral from mineralogist Jens Esmark, whose son Morten Esmark had found it on Lovoya Island, Norway. Esmark suspected it contained an unknown substance. His mineral is now known as thorite.


    Properties of thorium

    Thorium is radioactive and decays at a fixed rate into a series of other elements. In its pure state, thorium is a silvery-white metal that is stable in air and retains its luster for several months. If contaminated with oxide, however, it tarnishes slowly in air. It turns gray and eventually black. [See Periodic Table of the Elements]

    Thorium’s physical properties are strongly influenced by how much it is contaminated with oxide. Even the purest specimens of thorium often contain several tenths of a percent of oxide. Thorium oxide has a melting point of 3,300 C (5,972 F), the highest of all the oxides.

    Pure thorium is soft, very ductile, and can be swaged, drawn and cold-rolled. When heated in air, its turnings ignite and burn with a brilliantly white light. Powdered thorium is pyrophoric, requiring careful handling.

    Thorium is dimorphic, changing from a cubic to a body-centered cubic structure at 1,400 C (2,552 F). Thorium does not dissolve easily in most common acids (with the exception of hydrochloric) but water slowly attacks it.

    Much of the earth’s internally produced heat is attributed to thorium and uranium.

    Sources of thorium

    As a primordial nuclide, 232Th has existed in its current form for more than 4.5 billion years. Its existence predates the formation of Earth. Thorium was formed in the cores of dying stars through the r-process, and supernovas eventually scattered it across the galaxy. Its half-life is comparable to the age of the universe.

    Small amounts of thorium are found in most rocks and soils. Soil usually has an about 6 parts per million of thorium. Thorium is found in several minerals, including thorianite, monazite, and thorite. They occur on all continents, and thorium is now considered three times more abundant than uranium, or about as common as lead and molybdenum.

    Thorium is recovered commercially from rare-earth minerals and monazite, which is anything from 3-to-9 percent thorium. High-purity thorium has been made, and there are several methods for producing thorium metal.

    Uses of thorium

    Historically, thorium’s primary use was for the Welsbach mantle used in portable gaslights. Along with other ingredients, the thorium in these mantles produced a dazzling light when heated with a gas flame.

    Today, thorium metal is used as a source for nuclear power. Thorium-cycle converter-reactor systems are in development. Thorium’s abundance means that there is probably more energy available from thorium than from both uranium and fossil fuels, but any significant demand for thorium as a nuclear fuel is still several years in the future.

    Thorium is also used to coat the tungsten wire found in electronic equipment. Its presence as an alloying element in magnesium, imparting high strength and slowing resistance at elevated temperatures, plus its low-work function and high electron emission make it an excellent source for coating tungsten wire. Thorium oxide is also used to control grain size in tungsten when used in electric lamps and in high-temperature laboratory crucibles. Additionally, thorium oxide is useful as a catalyst in ammonia-to-nitric acid conversion, in petroleum cracking, and in sulfuric acid production.

    Gases containing thorium oxide are useful in producing high-quality camera lenses and scientific instruments. These gases have a high refractive index and low dispersion. 232Th is radioactive enough to expose a photographic plate in a few hours.

    Isotopes of thorium

    Thorium has 27 known radioisotopes. They range in atomic weight from 210 to 236 and all are unstable. 232Th is by far the most stable with a half-life as long as the universe — 14.05 billion years. Other isotopes are short lived, and are actually intermediates in the decay chain of higher elements. Only trace amounts of them are found. The longer-lived of these trace isotopes include: 230Th with a half-life of 75,380 years which is a daughter product of 238U decay; 229Th with a half-life of 7,340 years and 228Th with a half-life of 1.92 years. All of the remaining radioactive isotopes have half-lives that are less than 30 days and the majority of these have half-lives less than 10 minutes.

    232Th contains almost all naturally occurring thorium. It is an alpha emitter and goes through six alpha and four beta decay steps before becoming the stable isotope 208Pb.

    (Source: Los Alamos National Laboratory)

  • Case for climate change is overwhelming, say scientists

    Case for climate change is overwhelming, say scientists

    Eleven days before the IPCC publishes its latest report, a group of eminent scientists says there is massive evidence of human responsibility

    A flare stack emitting fire is silhouetted against the sun at an oil refinery in Melbourne June 24, 2009. A senator crucial to Australia's plans for carbon trading said on Wednesday he did not believe climate change was real, delivering what could be a fatal blow to government plans to slash industrial gas emissions. REUTERS/Mick Tsikas (AUSTRALIA POLITICS ENERGY ENVIRONMENT BUSINESS IMAGES OF THE DAY) :rel:d:bm:GF2E56O0NFZ01

    Scientists say that if humans continue with business as usual, using fossil fuels and pumping out excessive amounts of greenhouse gases, the world will be on track for a planet that is 4C warmer by the end of this century Photograph: Mick Tsikas/Reuters
    With the IPCC report not yet published, there is already heated debate about what it will say, and about the implications of its findings for human development.

    The scientists’ statement is unequivocal, and is not based on whatever the IPCC may publish. They say: “The body of evidence indicating that our civilisation has already caused significant global warming is overwhelming.”

    The statement comes from 12 members of the recently established Earth League, which describes itself as “a voluntary alliance of leading scientists and institutions dealing with planetary processes and sustainability issues”.

    They say that if humans continue with business as usual, using fossil fuels and pumping out excessive amounts of greenhouse gases, the world will be on track for a planet that is 4C warmer by the end of this century, or even earlier.

    The group says assertions that there has been no warming this century are simply wrong. “Regardless of the… (erroneous) claim that global warming has already stopped, evidence is that once well-known impacts from El Niño, volcanic aerosols and solar variability are removed from the observations, the warming trend of the ocean-atmosphere system is unbroken; and that it will continue (potentially towards 4°C) unless serious mitigation action is taken.

    “That global warming continues unabated over the last decade is confirmed by ocean measurements. Ninety per cent of the additional heat that the Earth system absorbs due to the increase in greenhouse gases is stored in the oceans, and the global array of thousands of scientific measurement robots in the oceans proves that they keep heating up at a steady pace. Meanwhile satellites show that sea levels also keep rising steadily.”

    The statement says a 4°C rise would drastically change the Earth. Some coastlines and entire islands would be submerged by rising sea levels, and more extreme heat waves would cause crop failures and loss of life.

    It says powerful feedback processes that would very probably raise the warming even higher could be triggered, and might prove irreversible: “Four degrees of planetary warming means some 8°C change close to the Arctic, which will cause even larger impacts on the Eurasian and North American land mass and the surrounding seas.”

    “…our societies seem to be willing to impose immense risks on future generations.”

    Already, it says, there is persuasive evidence that immense changes may be under way: “The last two decades were… punctuated by devastating floods (like the Pakistan deluge in 2010) that may be related to an incipient restructuring of the atmospheric circulation.

    “The signs on the climate wall as expressed by the accelerated melting of Arctic sea ice and by the retreat of the overwhelming majority of glaciers worldwide are there for all to see. Yet this is just the beginning.”

    The scientists say: “Although climate science only tells us what might happen and not what to do about it, we feel that inaction is an unacceptable prospect.

    “Nations go to war, implement mass vaccinations of their populations and organise expensive insurance and security systems (such as anti-terror measures) to address much fainter threats. However, our societies seem to be willing to impose immense risks on future generations.”

    The 12 signatories recognise that some people believe it is impossible for human activities to produce a 4°C temperature rise. Others, they say, are already acknowledging defeat by maintaining that the international policy goal of limiting warming to less than 2°C is a lost case.

    They write that there is “ample evidence” that the world can hold a 2°C line, and say technology shows that global sustainability is attainable. But they add: “… the evidence demonstrates that the time frame to achieve this is rapidly shrinking.”

    The signatories of the statement include Professor Hans Joachim Schellnhuber, of the Potsdam Institute for Climate Impact Research, Germany, and Professor Sir Brian Hoskins, Director of the Grantham Institute for Climate Change at Imperial College London. The link above lists all 12 signatories.

  • The 5 stages of climate denial are on display ahead of the IPCC report