You are here: Home Environment Energy Smart Article
Money trail backs the clean energy revolution
- Date
- August 31, 2013
- 151 reading now
- (150)
Ben Cubby, Peter Hannam
Across Australia, thousands of rooftops have been turned into solar-power money generators.
Here’s a bright idea: what if, instead of paying for solar panels to keep your electricity bills down, you asked a solar company to put them on your roof for free, then paid them back with excess energy that you didn’t need?
Well, it’s already happening. Solar panel installation with no upfront payments, paid off over several years from the money saved out of your power bills, began in Australia almost two years ago. In a few years, it is likely that companies will be competing with each other to pay you for the privilege of using your roof to generate electricity for your home.
What we are seeing is a transition from high carbon to a low carbon system.
If that sounds fanciful, bear in mind that a decade ago there were just a few hundred working solar-powered home in the country, run mostly at significant personal expense by enthusiasts. By the end of last year, 936,810 solar systems were installed, and the number cruised past 1 million earlier this year.
Slowly but surely, renewable energy is eating into the business model of the fossil-fuel-burning energy generators. Those in the industry liken it to the effect the internet is having on publishing: disrupting revenue, overturning tradition and, literally, tilting the balance of power in favour of the customer, rather than big corporations.
Oliver Yates, a former Macquarie Bank executive who was appointed to head the government’s Clean Energy Finance Corporation, describes renewable energy as ”the android on the pitch”.
The analogy goes that the traditional big players are now competing with new opposition that does not have to worry about week-to-week fluctuations in fuel costs, mining approvals, or the burdens of paying for a massive electricity grid. Whenever there is sunshine or wind blowing, the android keeps plodding along. When it isn’t, the traditional players are called back off the substitutes bench to kick on.
”At the end of the day, if your competitor is doing the same job for less, it’s a problem for you,” Yates says. ”Increasingly, we will see this taking effect on the profitability of the traditional players.”
At present, a small 1.5-kilowatt solar panel system might set a householder back about $4500, less a rebate of about $900, and would pay itself off in about seven years from savings on energy bills. According to the Climate Commission, the cost of a solar panel this year has dropped to less than a quarter of its price in 2002, driven by mass production of highly efficient solar panels in China.
But not everyone can afford that kind of outlay, especially given that solar panels are more popular in rural areas and outer city suburbs that tend to have lower and middle incomes. In Sydney, Blacktown is the solar energy epicentre, while solar panels in Melbourne’s working class west outstrip those in the inner city by five to one. In South Australia, 19.2 per cent of all households are now solar-powered, according to data from consultancy CleanTechnica.
One of the new players trying to take advantage of the android effect is California-based SunPower, which launched in Australia earlier this month, in partnership with local credit union Community First.
Its business model is based on free installation of solar panels, lengthy 10-year loans from the credit union to spread out repayments and payback based on the amount of power generated. It’s in everyone’s interest to generate as much renewable energy as possible – except existing power providers that rely on burning coal or gas.
”Initially, SunPower partners work with home owners interested in purchasing a solar power system to determine what size system would best meet their energy needs,” company chief executive Tom Werner says.
”They follow a precise method in order to understand the home owner’s energy profile, using this information to design a tailored solar power system. For example, they consider how much energy the home owner consumes and during which times, where they’re located geographically and any local incentives. In most cases, home owners should be able to pay monthly loan payments with the savings generated.”
The claims of many solar companies are yet to be tested, because the industry is growing fast and few people have been connected to the electricity grid for long enough to fully pay off the systems they have bought. The best that can be said is that the sums appear to add up.
Of course, a lot of this depends on policy settings, at state and federal government levels. The number of panel installations have increased less rapidly since subsidies began to be rolled back, as state governments decided their various feed-in tariff schemes were too popular.
NSW will shortly release its Renewable Energy Action Plan in a bid to grab a bigger share of the renewable energy investment that will be needed if Australia is to hit its target of supplying 20 per cent of power from clean energy sources by 2020.
A draft version of the plan boasts that NSW already has the largest installed renewable energy capacity in the country – although about 86 per cent of the total at the time of its release was in hydropower plants built decades earlier.
The O’Farrell government has made modest steps to close the non-hydro renewable energy gap by tipping in more than $400,000 to help community renewable energy projects get a start. It has also acted on one of its draft action plan goals by appointing Australia’s first renewable energy advocate, Amy Kean.
Kean says that the industry already employs 25,000 people in the state and is the base for 45 per cent of Australian firms in the sector.
“NSW is a hub for renewable energy companies.”
While she plans to avoid “picking winners” among the technologies, Kean knows her role will inevitably thrust her into the fray when country communities battle new projects such as wind farms because of perceived health risks or despoilment of the landscape.
“I would advocate the important role of consultation and education with communities based on the evidence,” Kean says.
Work by the National Health and Medical Research Council and other such bodies “needs to be communicated to communities”, she says.
Kean says her role will have “a degree of independence”, not unlike that of the state’s Chief Scientist, Mary O’Kane, in her ability to give advice across government and sometimes in opposition to it.
With the federal opposition poised to dismantle or change much of the infrastructure built up around renewable energy should it win government, that advocacy role may take on extra importance.
At present, the Coalition has promised to abolish the carbon price, the Clean Energy Finance Corporation and the Climate Change Authority – which will recommend the greenhouse gas reduction targets that will in turn influence renewable energy growth.
This week it also announced that it would cut funding to the Australian Renewable Energy Agency – an independent group that oversees about $3.2 billion in renewables investment, and which the opposition has previously said would be retained.
The exact nature of the newly pledged cuts remains obscure.
”There will be some savings over the forward estimates – those details will be out with the full costings before the election,” a spokeswoman said.
The head of the renewable energy agency, Ivor Frischknecht, had told Fairfax Media earlier in the election campaign that he believed his agency would be left untouched by the Coalition.
”It’s not been a topic that we’ve discussed. We have been given no reason at all to believe that,” Frischknecht said.
The election is seen by many in the renewables and finance sector as a fork in the road for renewable energy. Data prepared by banks and investors suggests a massive amount of private investment, totalling about $4.1 billion, would be held back over the next three years under a Coalition government, if it engaged in a campaign to force a repeal of the carbon price legislation in the Senate.
”Why would you spend money when there is real uncertainty around the return – people will just sit on it until the last minute,” one finance sector source said.
But the impact that would have on households is uncertain. Most of the effects would be felt in large-scale projects like wind farms and utility-scale solar power stations, with household renewable energy still expected to record big growth.
A key to the thinking of investors is that both major parties still support the mandatory renewable energy target, which dictates that a fifth of the nation’s total energy must come from renewables by 2020.
That provides some basis for thinking the cost of renewables will keep coming down, driven by fixed demand for fuel-free energy. And if the past five years are any measure, Chinese manufacturers will continue to churn out solar panels that are cheaper and cheaper.
”There is an enormous amount of capital tied up in our energy systems, and what we are seeing is a transition from high carbon to a low carbon system,” Yates says.
”What we’re heading into is a period of sustained high volatility in the industry. There is a high possibility that, if this is not managed correctly, we will all end up with much higher costs than we could have had.
”You can transform the energy system in a non-disruptive fashion or in a disruptive fashion … But ultimately it is


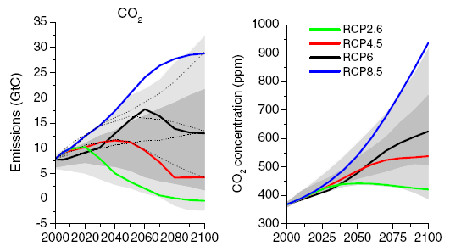 Emissions of main greenhouse gases across the RCPs (left), and trends in concentrations of greenhouse gases (right). Grey area indicates the 98th and 90th percentiles (light/dark grey) of the literature. The dotted lines indicate four of the SRES marker scenarios. (Graphs from van Vuuren et.al. (2011).Each RCP was developed independently by a modelling team whose previous work was a close match to the starting requirements for the new scenarios. To determine the trajectories of emissions and forcings for each RCP, the teams reviewed the existing literature and synthesized values for a wide range of scientific and socioeconomic data, like population growth, GDP, air pollution, land use and energy sources.
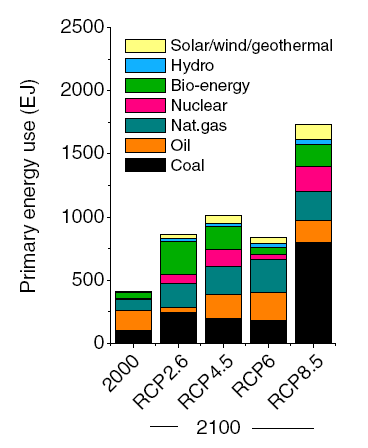 Energy sources by sector (van Vuuren et.al. 2011)Why were new scenarios necessary? One reason is efficiency; the RCPs allow more flexibility (and reduced costs) in modelling processes. Possibly the most important improvement is that, unlike SRES, RCPs allow teams to test different social, legislative and other policy initiatives, and see the economic effects as well as environmental; mitigation results as well as adaptation.


