Category: Uncategorized

  • Arctic thawing could cost the world $60tn, scientists say

    Arctic thawing could cost the world $60tn, scientists say

    Methane released by a thinning permafrost may trigger catastrophic climate change and devastate global economy

    Arctic Permafrost melting in Liverpool Bay in Canada’s Northwest Territories

    A satellite picture reveals permafrost melting around Liverpool Bay in Canada’s northwest territories in the Arctic region. Photograph: Nasa

    Rapid thawing of the Arctic could trigger a catastrophic “economic timebomb” which would cost trillions of dollars and undermine the global financial system, say a group of economists and polar scientists.

    Governments and industry have expected the widespread warming of the Arctic region in the past 20 years to be an economic boon, allowing the exploitation of new gas and oilfields and enabling shipping to travel faster between Europe and Asia. But the release of a single giant “pulse” of methane from thawing Arctic permafrost beneath the East Siberian sea “could come with a $60tn [£39tn] global price tag”, according to the researchers who have for the first time quantified the effects on the global economy.

    Even the slow emission of a much smaller proportion of the vast quantities of methane locked up in the Arctic permafrost and offshore waters could trigger catastrophic climate change and “steep” economic losses, they say.

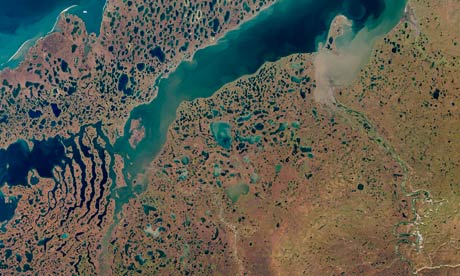
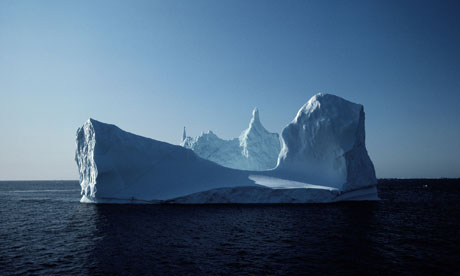
    The Arctic sea ice, which largely melts and reforms each year, is declining at an unprecedented rate. In 2013, it collapsed to under 3.5m sqkm by mid September, just 40% of its usual extent in the 1970s. Because the ice is also losing its thickness, some scientists expect the Arctic ocean to be largely free of summer ice by 2020.

    The growing fear is that as the ice retreats, the warming of the sea water will allow offshore permafrost to release ever greater quantities of methane. A giant reservoir of the greenhouse gas, in the form of gas hydrates on the East Siberian Arctic Shelf (ESAS), could be emitted, either slowly over 50 years or catastrophically fast over a shorter time frame, say the researchers.

    The ramifications of vanishing ice will also be felt far from the poles, they say because the region is pivotal to the functioning of Earth systems, such as oceans and climate. “The imminent disappearance of the summer sea ice in the Arctic will have enormous implications for both the acceleration of climate change, and the release of methane from off-shore waters which are now able to warm up in the summer,” said Prof Peter Wadhams, head of the Polar ocean physics group at Cambridge University and one of the authors of the paper published in the journal Nature.

    “This massive methane boost will have major implications for global economies and societies. Much of those costs would be borne by developing countries in the form of extreme weather, flooding and impacts on health and agricultural production,” he said.

    According to the authors, who using the Stern review, calculated that 80% of the extra impacts by value will occur in the poorer economies of Africa, Asia and South America. “Inundation of low-lying areas, extreme heat stress, droughts and storms are all magnified by the extra methane emissions,” they authors write. They argue that global economic bodies have not taken into account the risks of rapid ice melt and that the only economic downside to the warming of the Arctic they have identified so far has been the possible risk of oil spills.

    But, they say, economists are missing the big picture. “Neither the World Economic Forum nor the International Monetary Fund currently recognise the economic danger of Arctic change. [They must] pay much more attention to this invisible time-bomb. The impacts of just one [giant “pulse” of methane] approaches the $70-tn value of the world economy in 2012″, said Prof Gail Whiteman, at the Rotterdam School of Management and another author.

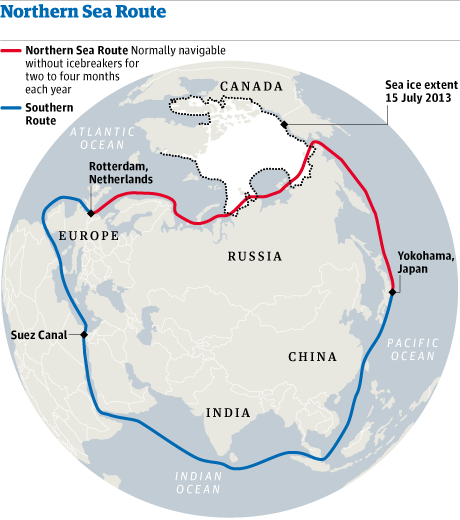
    The Nature report comes as global shipping companies prepare to send a record number of vessels across the north of Russia later in 2013, slashing miles travelled between Asia and Europe by over 35% and cutting costs up to 40%.

    According to Russian authorities, 218 ships from Korea, China, Japan, Norway, Germany and elsewhere have so far applied for permission to follow the “Northern sea route” (NSR) this year. This route uses the Bering Strait between Siberia and Alaska and is only open for a few months each year with an icebreaker.

    But following 2012’s record collapse of the Arctic sea ice, shipping companies are gaining confidence to use the route. In 2012, only 46 ships sailed its entire length from the Atlantic to Pacific oceans and in 2011 only four. The route can save even medium-sized bulk carrier 10-15 days and hundreds of tonnes of bunker fuel on a journey between northern Norway and China.

    Satellite data collated from the US National snow and ice data centre in Boulder, Colorado this week showed ice loss now accelerating and, at 8.2m sqkm (3.2m square miles) approaching the same extent as during last year’s record melt. Over 130,000 sqkm of sea ice melted between July 1 and 15. “Compared to the 1981 to 2010 average, ice extent on July 15 was 1.06m sqkm (409,000 square miles) below average,” said a spokseman.

    Northern sea route

  • Dallol Volcano and Hydrothermal Field

    Dallol Volcano and Hydrothermal Field

    One of the world’s strangest volcanic landscapes is located 269 feet below sea level in the Danakil Depression of Ethiopia

    Dallol Crater

    Mud, salt, iron stains, halophile algae and hot spring activity produce a colorful but dangerous landscape in the Dallol craters. The most recent was formed in 1926 by a phreatic eruption that blasted through shallow salt and sediments to produce a maar. A continuous flow of supersaline hydrothermal water feeds the colorful lakes and alters the original eruption site. Image © iStockphoto and Matejh Photography.

    Geologic Setting of the Danakil Depression

    The Danakil Depression is a rift valley that parallels the Red Sea in northern Ethiopia. It is a minor structure related to the rift between Africa and the Arabian peninsula. As the rift opens the floor of the Danakil Depression subsides. After millions of years of subsidence the deepest part of the depression is about 410 feet below sea level. It is one of the lowest points on Earth.

    Several times during the formation of the Denakil Depression, water has overtopped the divide between the Denakil Basin and the Red Sea flooding the basin with seawater. Thick evaporite sequences were deposited in the basin as the seawater evaporated in the hot dry climate. Some of the evaporite deposits were formed by evaporating run-off water and evaporating hydrothermal brines.

    The Dallol area is one of the hottest areas on Earth. The average daily maximum temperature is 106 degrees Fahrenheit and the annual mean temperature is 94 degrees Fahrenheit. During the rainy season large portions of the Danakil depression can be covered with runoff water.

    Volcanic Activity in the Danakil Depression

    Much of the floor of the Danakil Depression is covered by salt flats. Other areas are covered by basalt flows, shield volcanoes and cinder cones. Several craters up to a mile across can be seen on the salt flats. These are thought to be maars formed by phreatic eruptions.

    The most recent eruption occurred in 1926 when a body of magma ascended towards Earth’s surface in the Danakil Depression near the boundary of northern Ethiopia and Eritrea. The rising magma body penetrated the salt on its way to the surface and a phreatic explosion formed a small maar about 100 feet across at the eruption site.

    Hot Springs and the Dallol Landscape

    Dallol has some of the most colorful landscapes on Earth. The hot magma below heats groundwater flowing in from the surrounding highlands. This hot water moves up towards the surface and through the evaporite deposits, dissolving salt, potash and other soluble minerals.

    terraced salt deposits at Dallol

    Terraced salt deposits in one of the Dallol craters, stained yellow, brown and green. Image © iStockphoto and Matejh Photography.

    The supersaturated brine emerges through hot springs in the floor of the craters. As the brines evaporate in the hot arid climate extensive salt formations are formed on the floor of the craters. These are colored white, yellow, brown, orange and green by sulfur, dissolved iron, mud and the life activity of halophile algae.

    The actions of the hot springs, the deposition of salt, and sediments washed in by run-off have modified the geometry of the craters. Dallol craters are dangerous places to visit because their surface can be covered by a crust of salt with pools of hot acid water just inches below. Toxic gases are sometimes released from craters.

    In the past decade Dallol and Erta Ale, a volcanic area in the southeastern part of the Danakil Depression, have been frequently visited by tourists. These excursions can be risky because of the severe climate, the remote location and repeated attacks on tourists. Armed guards accompany many of the tour groups.

    Contributor:

    Find it on Geology.com

    More from Geology.com

    Oil from Space at Night: These night views of Earth show oil field illumination and gas flaring.

    sliding rocks

    Sliding Rocks Mystery:   What causes these rocks to slide across a Death Valley playa?.

    Top diamond producers

    Top Diamond Producers: Many countries outside of Africa are now sources of gem diamonds.

    rocks

    Wrong Volcano!   The most powerful eruption of the 20th century.
    diamonds from coal

    Biggest Misconception: Lots of people think that diamonds form from coal. Not True!

    what are minerals?

    Minerals:   Information about ore minerals, gem materials and rock-forming minerals.

    United States diamond mines and mining

    US Diamond Mines: Where are and where could diamonds be produced in the USA?

    fluorescent minerals

    Fluorescent Minerals glow with spectacular colors under ultraviolet light.
    Map of the Afar Triangle showing the location of the Dallol volcanic site in the Danakil Depression

    This map shows the location of the Dallol volcanic site in the Denakil Depression of Ethiopia. Note how the Denakil Depression paralles the Red Sea. Public domain map from the DEMIS Mapserver, used here under a Creative Commons License.
    Bing satellite image of the Dallol volcanic site. The orange, yellow and green salt deposits and acid ponds can be recognized if you zoom into the image. View Larger Map
  • Anthropogenic contributions to Australia’s record summer temperatures of 2013

    Anthropogenic contributions to Australia’s record summer temperatures of 2013

    1. Sophie C. Lewis*,
    2. David J. Karoly

    Article first published online: 23 JUL 2013

    DOI: 10.1002/grl.50673

    Keywords:

    • attribution;
    • Australia;
    • summer;
    • ENSO;
    • extremes

    Abstract

    [1] Anthropogenic contributions to the record hot 2013 Australian summer are investigated using a suite of climate model experiments. This was the hottest Australian summer in the observational record. Australian area-average summer temperatures for simulations with natural forcings only were compared to simulations with anthropogenic and natural forcings for the period 1976–2005 and the RCP8.5 high emission simulation (2006–2020) from nine Coupled Model Intercomparison Project phase 5 models. Using fraction of attributable risk to compare the likelihood of extreme Australian summer temperatures between the experiments, it was very likely (>90% confidence) there was at least a 2.5 times increase in the odds of extreme heat due to human influences using simulations to 2005, and a fivefold increase in this risk using simulations for 2006–2020. The human contribution to the increased odds of Australian summer extremes like 2013 was substantial, while natural climate variations alone, including El Niño Southern Oscillation, are unlikely to explain the record temperature.

  • Arctic methane release is an ‘economic time bomb’ – study

    Arctic methane release is an ‘economic time bomb’ – study

    Disappearance of Arctic sea ice could trigger devastating methane release costing the world’s entire GDP

    arctic iceberg

    Arctic iceberg Photograph: Delphine Star/getty images

    The release of a giant methane pulse from thawing Arctic permafrost could destabilise the climate system and trigger huge costs to the global economy within coming decades, warns a forthcoming paper in the journal Nature.

    The paper highlights the link between the “unprecedented rate” of melting of Arctic sea ice, and the intensifying methane emissions from thawing offshore permafrost. The East Siberian Arctic Shelf (ESAS) alone carries a 50 Gigatonne (Gt) reservoir of methane gas hydrates which could be released slowly over 50 years or “catastrophically fast” in a matter of decades under the current pace of global warming.

    The increasing release of methane coupled with the loss of Arctic sea ice would create an amplifying feedback “speeding up sea-ice retreat, reducing the reflection of solar energy and hastening sea-level rise as the Greenland ice sheet melt accelerates.” Recent research on ‘Arctic amplification’ has demonstrated a complex relationship between the earth system and the Arctic. The accelerating melt process is already altering the jet stream which seems to be multiplying and accentuating extreme weather events.

    As I wrote in May:

    “Extreme weather events over the last few years apparently driven by the accelerating Arctic melt process – including unprecedented heatwaves and droughts in the US and Russia, along with snowstorms and cold weather in northern Europe – have undermined harvests, dramatically impacting global food production and contributing to civil unrest.”

    The authors of the Nature article, modelling the potential consequences of the 50 Gt East Siberian methane release over different time periods, conclude that it “will bring forward by 15–35 years the date at which the global mean temperature rise exceeds 2C above pre-industrial levels” – the ‘safe limit’ accepted by policymakers (though its safety has been disputed by leading scientists).

    Under a business as usual scenario, this will generate an “extra $60 trillion (net present value) of mean climate change impacts” – nearly the same value as the entire GDP of the global economy. The lower emissions scenario (which unfortunately looks far less plausible at the moment) would “be an extra $37 trillion” – still over half of world GDP.

    Two of the Nature authors are leading business school scholars – Prof Gail Whiteman at the Department of Business-Society Management, Erasmus University, and Dr Chris Hope at the Judge Business School, Cambridge University. The third author is Prof Peter Wadhams, Head of the Polar Ocean Physics Group at Cambridge.

    They point out that 80% of climate change impacts will hit poorer, less developed countries through “inundation of low-lying areas, extreme heat stress, droughts and storms”, all of which will be “magnified by the extra methane emissions.” But they also emphasise that their analysis only focuses on potential impacts from “one feedback” involving methane release from the ESAS, and is therefore probably “conservative” – implying actual costs could be much higher. They warn of an urgent need to:

    “… re-direct economic attention from short-term economic gains from shipping and extraction to what appears to be an economic time-bomb… The costs of Arctic change carry significant – yet thus far invisible – risks to our global economic foundations.”

    The authors urge the World Economic Forum, the International Monetary Fund, and other financial institutions to embark on new research accounting for such dramatic costs of Arctic climate change, which so far have been insufficiently recognised.

    Current models do not incorporate amplifying feedbacks such as “linking the extent of Arctic ice to increases in Arctic mean temperature, global sea level rise and ocean acidification”; nor do they include critical “feedback loops”, such as “the effects of black carbon deposits from forest and agricultural fires, diesel use and industrial activity on snow and ice reflectivity and melting”, as well as links between Arctic sea ice extent, global sea level rise, increased shipping and the increase in Arctic local temperatures. Without analysing these factors, “world leaders and economists will continue to miss the big picture.”

    The extent to which the majority of climate models have underplayed the scale of the challenge in the Arctic is evident from a new paper in Proceedings of the National Academy of Sciences (PNAS) which projects that the Arctic will be ice free in September by around 2054-58. The projection departs significantly, however, from actual empirical observations of the rapid loss of Arctic summer sea ice which is heading for disappearance within three years according to Nature co-author and renowned sea ice expert Prof Wadhams.

    NASA airborne surveillance in the Arctic has already encountered large “plumes of methane” as much as 150 kilometres wide. While no one knows for sure how and when a significant methane release might occur, recent evidence shows that once the Arctic summer sea ice disappears the chances of breaching a tipping point in methane release from melting permafrost are far higher.

    New research led by Dr Anton Vaks of Oxford University reconstructing the history of Siberian permafrost shows that continuous melting sufficient to release significant quantities of methane would begin at around 1.5C, a temperature rise to which the world is already committed early this century.

    Underscoring the urgency of mitigation efforts, the Nature paper warns that it would be:

    “… difficult, perhaps impossible, to avoid large methane releases in the East Siberian Sea without significant reductions in global emissions of CO2, since it is seabed warming, a product of summer sea ice retreat, which directly drives the methane release.”

    If Prof Wadhams is correct in his forecast that the summer sea ice will be gone by 2016, then we could be closer to the tipping point than we realise.

    Dr Nafeez Ahmed is executive director of the Institute for Policy Research & Development and author of A User’s Guide to the Crisis of Civilisation: And How to Save It among other books. Follow him on Twitter @nafeezahmed

  • Harvesting electricity from the greenhouse gas carbon dioxide

    Harvesting electricity from the greenhouse gas carbon dioxide

    Published: Tuesday, July 23, 2013 – 20:32 in Physics & Chemistry

    A new method for producing electricity from carbon dioxide could be the start of a classic trash-to-treasure story for the troublesome greenhouse gas, scientists are reporting. Described in an article in ACS’ newly launched journal Environmental Science & Technology Letters, the method uses CO2 from electric power plant and other smokestacks as the raw material for making electricity. Bert Hamelers, Ph.D., and colleagues explain that electric power-generating stations worldwide release about 12 billion tons of CO2 annually from combustion of coal, oil and natural gas. Home and commercial heating produces another 11 billion tons. Smokestack gas from a typical coal-fired plant contains about 10 percent CO2, which not only goes to waste, but is a key contributor to global warming. Hamelers’ team sought a way to change that trash into a treasure.

    They describe technology that would react the CO2 with water or other liquids and, with further processing, produce a flow of electrons that make up electric current. It could produce about 1,570 kilowatts of additional electricity annually if used to harvest CO2 from power plants, industry and residences. That’s about 400 times the annual electrical output of the Hoover Dam. Like that dam and other hydroelectric power facilities, that massive additional amount of electricity would be produced without adding more CO2 to the atmosphere, Hamelers pointed out.

  • The Great Arctic Flush

    Sunday, July 21, 2013

    The Great Arctic Flush

    By Paul Beckwith

    A massive cyclone is forecast to develop in the Arctic, as shown on the image below, from the Naval Research Laboratory.

    Within 2 weeks the Arctic Ocean will be completely transformed. The cyclone that appears 6 days out on both the US and European ten day forecasts will massacre the sea ice in what I call “The Great Arctic flush”.

    The image below is a forecast for Arctic sea ice speed and drift on July 27, 2013. More images, including animations, on Arctic sea ice can be viewed at http://www7320.nrlssc.navy.mil/hycomARC/arctic.html
    Last August, a massive cyclone formed over the Arctic Ocean and destroyed 800,000 square km of ice in about a week. The predicted cyclone looks to be as strong as the one in early August, 2012. Problem is, the ice is much weaker, thinner and fractured this year; including all the ice just north of the Canadian Arctic Archipelago that is 4 or 5 meters thick; this ice is mobile, broken, fractured ice piled up into ridges; it is not multiyear ice (MYI) at all.
    Above image, from the Naval Research Laboratory is a prediction of ice speed and drift a week from now, showing the motion of the ice, the darker and redder the faster, the ice is being set in motion by the cyclone above. Since the Coriolis force flings things to the right, the ice is all sent to the outside of the rotation, into the warmer surrounding water as well as the Atlantic Ocean. The storm surge of a foot or two over the entire basin (highest near the cyclone eye) will draw in warm water from the Pacific via the Bering Strait and from the Atlantic via the Fram Strait. It will also mix the fresh water on the surface from melting ice with warmer saltier water from below. It will also generate lots of churning and grinding of the ice and waves several meters high. Warm and smoky air that is filled with ash and black carbon from burning fires in the far north will drop the albedo of the ice and increase the solar absorption.
    When I forecast zero sea ice at the end of the melt season this summer, I fully expected at least one or more of these massive cyclonic storms. Last year it occurred in early August, and lasted for about 8 days. In the rest of the melt season last year no other huge cyclone developed, although several small ones did. Perhaps the cyclone disturbed the ocean conditions enough to prevent subsequent ones occurring. We shall see this year…

    edited screenshot from animation at weather-forecast.com

    Paul Beckwith is a part-time professor with the laboratory for paleoclimatology and climatology, department of geography, University of Ottawa. He teaches second year climatology/meteorology. His PhD research topic is “Abrupt climate change in the past and present.” He holds an M.Sc. in laser physics and a B.Eng. in engineering physics and reached the rank of chess master in a previous life.