Category: Uncategorized

  • Climate Change: Part II – world effects By News Staff on June 21, 2013 in Gov

    Climate Change: Part II – world effects

    By on June 21, 2013 in Gov
    climatechangePart II– How does Climate Change Affect the World?

    Provided by the Fort Independence Environmental Climate Change Working Group

    Chair: Dennis Mattinson

    1. How can a change of one or two degrees in global average temperatures have an impact on our lives? 

    Changing the average global temperature by even a degree or two can lead to serious consequences around the globe. For about every 2°F of warming, we can expect to see:

    5—15% reductions in the yields of crops as currently grown

    3—10% increases in the amount of rain falling during the heaviest precipitation events, which can increase flooding risks

    5—10% decreases in stream flow in some river basins, including the Arkansas and the Rio Grande

    200%—400% increases in the area burned by wildfire in parts of the western United States [6]

    Global average temperatures have increased more than 1.4 degrees Fahrenheit over the last 100 years. [2] Many of the extreme precipitation and heat events that we have seen in recent years are consistent with what we would expect given this amount of warming. [5] Scientists project that Earth’s average temperatures will rise between 2 and 12 degrees Fahrenheit by 2100. [1]

    2. Do emissions of carbon dioxide from human activities have a big impact on Earth’s climate?

    Plants, oceans, and soils release and absorb large quantities of carbon dioxide as a part of the Earth’s natural carbon cycle. These natural emissions and absorptions of carbon dioxide on average balance out over time. However, the carbon dioxide from human activities is not part of this natural balance. Ice core measurements reveal that carbon dioxide levels in the atmosphere are higher than they have been for at least 800,000 years. [5] The global warming that has been observed in recent decades was caused by elevated levels of carbon dioxide and other greenhouse gases in the atmosphere, due primarily to human activities. [1]

    3. Will a small rise in sea level affect people (even in the United States)?

    A small rise in sea level will affect many people, even in the United States. The amount of sea level rise expected to occur as a result of climate change will increase the risk of coastal flooding for millions to hundreds of millions of people around the world, many of whom would have to permanently leave their homes. [7] Global sea level has risen approximately 9 inches, on average, in the last 140 years. [4] This has already put some coastal homes, beaches, roads, bridges, and wildlife at risk. [5] By the year 2100, sea level is expected to rise another 1.5 to 3 feet. [6] Rising seas will make coastal storms and the associated storm surges more frequent and destructive. For example, in New York City what is currently termed a once-in-a-century coastal flooding event could occur as frequently as once per decade. [5]

    References

    1. NRC (2011). America’s Climate Choices: Final Report.   National Research Council. The National Academies Press, Washington, DC, USA.
    2. NRC (2010). Advancing the Science of Climate Change.   National Research Council. The National Academies Press, Washington, DC, USA.
    3. NOAA (2011). 2010 Tied For Warmest Year on Record. National Oceanic and Atmospheric Administration. Accessed 3/16/2012.
    4. EPA (2010). Climate Change Indicators in the United States. U.S. Environmental Protection Agency, Washington, DC, USA.
    5. USGCRP (2009). Global Climate Change Impacts in the United States. Thomas R. Karl, Jerry M. Melillo, and Thomas C. Peterson (eds.). United States Global Change Research Program. Cambridge University Press, New York, NY, USA.
    6. NRC (2011). Climate Stabilization Targets: Emissions, Concentrations, and Impacts over Decades to Millennia. National Research Council. The National Academies Press, Washington, DC, USA.
    7. IPCC (2007). Climate Change 2007: Synthesis Report.  Contribution of Working Groups I, II and III to the Fourth Assessment Report of the Intergovernmental Panel on Climate Change [Pachauri, R.K. and A. Reisinger (eds.)]. Geneva, Switzerland.


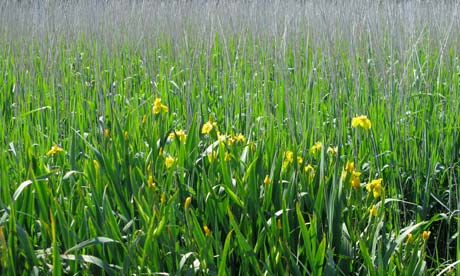
    4.  What are the effects of Climate Change on world life?

    Life on Earth is profoundly affected by the planet’s climate. Animals, plants, and other living beings around the globe are moving, adapting, and, in some cases, dying as a direct or indirect result of environmental shifts associated with our changing climate—disrupting intricate interactions among Earth’s species, with profound implications for the natural systems on which humans depend. Climate change is happening on a global scale, but the ecological impacts are often local. – (COMMITTEE ON ECOLOGICAL IMPACTS OF CLIMATE CHANGE)-


  • Immigration helps drive Australian population explosion to new heights

    Immigration helps drive Australian population explosion to new heights

    Immigration helps drive Australian population explosion to new heightsImmigration helps drive Australian population explosion to new heights

    A recently-issued government report states that Australia’s population growth in 2012 has returned to the excessive increases seen in 2009, and attributes migration from overseas as the main reason.

    The report by the Australian Bureau of Statistics (ABS) estimates a growth of 1.8 per cent, the level supported by previous prime minister Kevin Rudd and renounced by Julia Gilliard after her election victory. It’s being suggested that the Gilliard government has been quietly restoring immigration levels to those endorsed by Rudd.

    ABS director Bjorn Jarvis has confirmed that the population increase has been largely driven by increased immigration, Net overseas migration, he said, added 235,900 individuals to the population in 2012, representing a 17 per cent increase over the previous year.

    Natural increase, he added, was responsible to 40 per cent of the population growth, a four per cent increase over the past year, and 60 per cent was due to increased numbers of migrants. Western Australia had the largest increase of all states, with 2.47 million by the end of last year, and the lowest population growth of just 0.1 per cent was recorded in Tasmania.

    Previous statistics have shown that Asia, and China and India in particular, are now the major sources of migrants to Australia, overtaking those from Britain, traditionally the main source over many years. It remains to be seen how the recent sweeping changes in immigration law will affect population totals in the future.

    1 1 1

    Related Stories:

    – See more at: http://www.emigrate.co.uk/news/20130621-7158_immigration-spurs-oz-population-growth#sthash.V17q3oZv.gDf0RhWi.dpuf

  • Parklea-Kellyville ridge ranks 13th on Housing Industry Association Population and Residential Building list

    Parklea-Kellyville ridge ranks 13th on Housing Industry Association Population and Residential Building list


    Kellyville Population Boom

    Zanna Kotronakis with her children Adriane, 6, and Julian, 8, at their home in Kellyville. Picture: Fotiadis John Source: The Daily Telegraph

    A MASSIVE influx of families is driving a population boom in Sydney’s north-west, with the Parklea-Kellyville Ridge area rating 13th on a national housing and construction growth survey.

    The area’s population grew by 10.2 per cent in the last financial year, putting it on the Housing Industry Association (HIA) Population and Residential Building Hotspots list.

    The Homebush Bay-Silverwater region, with a nine per cent population growth, rated 18th. It was the only other NSW area to make the list, which was dominated by Victoria and Western Australia and covers areas with more than $100 million in residential building work approved.

    “The Parklea-Kellyville Ridge area has been a fast-growing home building area for some time now within an overall under-performing Sydney market,” said HIA economist Harley Dale.

    “Some 89 per cent of households in that area are made up of families.”


    Sydney property prices boom to beat Manhattan, London

    Sydney’s west to lead housing boom

    Elise Lau of McGrath Castle Hill said traffic for open homes in the region had doubled in the past six months.

    Major arteries in all directions means it is well placed for road transport, while the planned North West Rail Link will add to transport infrastructure.

    Zanna Kotronakis, who has lived in Kellyville for 13 years, said the rush of people to the area had been sudden with houses popping up everywhere.

    “The road between Windsor and Parklea used to be rural, but in the last few months, all these houses have sprung up,” Mrs Kotronakis said.

    In contrast, the nine per cent population growth in Homebush Bay-Silverwater reflected interest from professionals, downsizers and investors.


  • The Dwyfor is surely one of the loveliest of Welsh rivers

    The Dwyfor is surely one of the loveliest of Welsh rivers

    Llanystumdwy: In the black ooze, flags are flowering – vibrant yellow against a faint lilac in the stems of last year’s reeds

    Country Diary  : Yellow flags and last year's reeds alongside the Dwyfor, Llanystumdwy, Wales

    Yellow flags and last year’s reeds alongside the Dwyfor, Llanystumdwy, Wales. Photograph: Jim Perrin

    A friendly young sheepdog, made idle by the sun, yawns and scratches in the farmyard, from which a path descends behind a tip of broken asbestos and old tyres to lead through beechwood and arrive at the bank of the Afon Dwyfor. Despite the brevity of its course – barely a dozen miles from its source in the Eifionydd hills to the sea a mile west of Criccieth – few would argue against this being one of the loveliest of Welsh rivers. The late spring has adorned its banks with ramson and may. Translucence of young beech leaves overhead imparts a soft green dappling light. A pond-skater scissor-kicks upstream across velvet water. In the deep shade, drifts of seeding bluebells blanch and curl.

    Beyond Lloyd George’s grave I cross the main road and the railway to where the river sidles into a winding mile through meadows. The farmer from Aberkin is out hay-making, taking advantage of fine June weather, leaving bales wrapped in pale plastic mesh and scattered across the fields. I sit on a dyke, chew grass and watch the stream. Just below me, where a drain enters, the water is seething with activity. Fins break the surface. Large fish swirl round. A solitary dunlin on the muddy shore straightens from its feeding stoop, observes the commotion and scurries away protesting.

    I peer down into disturbed water and see a shoal of 50 or so grey mullet bottom-feeding in the shallows – handsome fish, some of them 2ft long, churning through the algal filth and sucking up whatever organic matter they find there. Opinion varies widely on their edibility, though I suspect their eating habits are the main taint to their gastronomic reputation. The river reaches a marsh before it curls round to merge with the waves. Duckboards of the new coastal path are laid across the mire. In the black ooze alongside, flags are flowering – vibrant yellow against a subtle, faint lilac in the stems of last year’s reeds.

  • Warming Ocean Biggest Driver of Antarctic Ice Melt


     44
     114  18
    comments

    0
    Print this page

    The Carbon Brief

    By Roz Pidcock

    Larsen Ice Shelf, NASA.

    Of Earth’s two vast ice sheets, Antarctica is perhaps the more mysterious. From the icy surface to the ocean below, there are several different ways the ice sheet is shrinking. How these processes compare is key to knowing how fast melting ice sheets are raising sea levels worldwide—and a new study may help to shed a bit more light.

    Ice Sheets and Sea Level Rise

    There is huge scientific interest in monitoring how the ice sheets are changing because when ice on land melts it drains into the ocean, causing sea levels to rise. Last week, a major review of how scientists’ understanding of ice sheet melt has advanced since the last Intergovernmental Panel on Climate Change (IPCC) report in 2007.

    But while Greenland is relatively well understood, at the other end of the planet in Antarctica, the picture is a little less clear, the report concludes.

    Antarctic Ice Shelves

    To understand how most of the ice is lost from Antarctica, a new study just published in Science looks to the ice shelves that surround 75 percent of the continent. Ice shelves are floating extensions of land ice that act as buttresses, stopping ice flowing from the interior straight out into the ocean.

    Iceshelf _locations
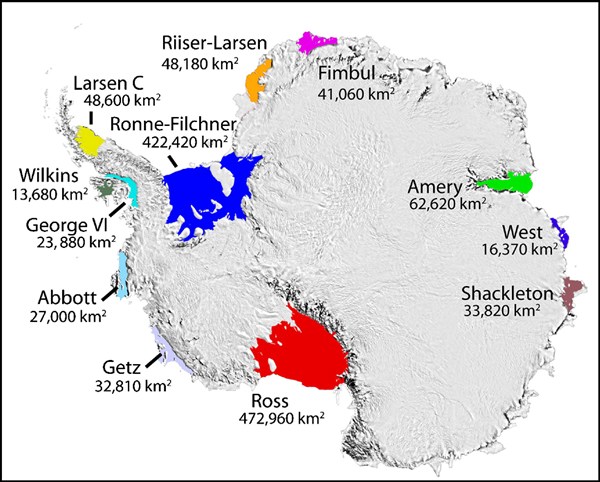
Ice shelves line 75 percent of the Antarctic coastline. The biggest ones are the Ross and Ronne-Filchner ice shelves, marked here in red and dark blue. Source: National Snow and Ice Data Centre

    Traditionally, scientists thought large chunks of solid ice breaking off the ice shelves was the main source of ice loss from Antarctica—a process known as iceberg calving. But there’s another way. As the ocean below the ice shelves warms, the ice melts from the bottom up—something scientists call basal melting. With melting from both the top and bottom, some ice shelves are getting noticeably thinner, says the new study.

    Bottom-up Melting

    The paper looked at both processes of ice loss across 99.5 percent of Antarctica’s ice shelves between 2003 and 2008. Overall, the scientists found basal melting caused 55 percent of ice loss, although they saw quite a lot of variation between regions. This makes bottom-up ice shelf melt the largest source of ice shelf loss in Antarctica. Previous studies have estimated the contribution to be more like 30 percent, or even as low as 10 percent.

    “[T]he role of the Southern Ocean in controlling the evolution of ice shelves, thereby the evolution of the ice sheet as a whole, is more significant  than estimated previously. This places more emphasis on understanding the evolution of the state of the Southern Ocean,” said Professor Eric Rignot from the University of California Irvine. Rignot, the lead author on the paper, also called the study a “game-changer.”

    The scientists found smaller ice shelves melted more than large ones. Giant ice shelves like the Ross, Filchner and Ronne occupy two-thirds of the total ice shelf area but accounted for just 15 percent of melting. Half of the meltwater came from 10 smaller ice shelves occupying just eight percent of the total area.

    An Uncertain Ice Sheet

    If Antarctica melted completely, scientists estimate it could add about 58 metres to global sea level. At the moment, satellite data indicates the Antarctic ice sheet is losing ice but only at a rate of about 0.2 mm per year—more than three times slower than Greenland.

    That’s partly because different parts of the ice sheet are changing in different ways. Even though ice shelves in West Antarctica and the Antarctic Peninsula are melting and breaking apart, this doesn’t contribute directly to sea level rise as they are already floating on water.

    But their thinning accelerates ice flow from the many glaciers in the continent’s interior, which does raise sea levels. Warmer air overlying the ice also causes melting on the surface. Nearly half of the ice shelves In East Antarctica are thinning too, according to the paper. But satellite data indicates the mass of ice in East Antarctica is growing overall thanks to an increase in snowfall.

    Scientists warn there are still lots of uncertainties about these estimates. So monitoring the contribution of different processes—and how they’re likely to change in the future—is critical for producing reliable projections of sea level rise.

    V

  • Pistols at Dawn ( MONBIOT )

    Monbiot.com


    Pistols at Dawn

    Posted: 21 Jun 2013 01:28 AM PDT

    A three-year, £100 bet on solar power has matured. Who won?


    By George Monbiot, published in the Guardian 21st June 2013

    Summer solstice. At dawn. What better time could there be for resolving a duel, albeit one not fought with flintlocks? The time is of my choosing, as the other party, though he accepted the challenge, would not agree terms. It is appropriate in another sense too, as this is the day with the longest hours of sunlight and therefore – for I honour the sporting tradition – it offers my opponent the best shot.

    Three years ago, in the course of our debate about the best means of generating electricity, I bet £100 against a claim made by Jeremy Leggett, chairman of the company SolarCentury. He had asserted that domestic solar power in Britain would achieve grid parity by 2013. This means that it would cost householders no more than conventional electricity.

    I’m interested in this question because I want to see carbon emissions cut as quickly and effectively as possible. If public money is used to back the wrong technologies, that represents a wasted opportunity. It is easy to become enthusiastic about domestic solar power, because it is produced on a small scale, gives people a satisfying sense of self-reliance, and is unobtrusive, unlike most other forms of generation.

    In fact it’s arguably the only form of electricity production which has widespread public support. The fact that it has been exceedingly lucrative for homeowners who installed their panels when state subsidies (the feed-in tariff) were high has contributed to that enthusiasm.

    But those of us who want carbon emissions to be greatly reduced should ask questions that are wider than only self-interest and aesthetics. We also have to ask whether a technology works. Solar power works well at low latitudes, especially in places where peak electricity demand coincides with peak sunlight, which is often the case where air conditioning is widely used. In terms of replacing conventional electricity, it works less well in places like the UK, which are far from the equator and have different patterns of use. Here, peak demand occurs between 5 and 7 o’clock on winter evenings.

    I was sceptical of Jeremy’s claim. So I bet that his prediction would not come to pass: grid parity would not be achieved by 2013. He accepted. I undertook to write an article in 2013 revealing the results, whether I won or lost. Here it is.

    To discover who had won, I first contacted the energy regulator, Ofgem, but it turned down my request. So I tried the Department for Energy and Climate Change. I asked two questions:

    – how should the outcome best be measured?

    – who will have to pay out £100?

    This is what it told me:

    “Grid parity can be defined as the point at which Government support for a technology is no longer required.”

    That seems like a reasonable definition to me, and one I’m prepared to accept. I hope Jeremy feels the same way: in 2010 I wrote to him several times to try to reach an agreement about how the outcome would be determined, but did not receive a reply.

    Here is DECC’s answer to my second question:

    “Grid parity for domestic scale solar power has not been reached. … The Feed-in Tariff scheme currently provides generation tariff of 15.44p per kWh, plus an export tariff of 4.64p per kWh for domestic scale installations.”

    Here is the source it gave me.

    In other words, though the subsidy has come down sharply from 2010, which partly reflects a real decline in the price of solar power and partly reflects the extraordinary generosity of the initial tariff, we’re a long way from grid parity.

    This, I think, highlights the danger of believing what we want to believe. Climate change is too serious to mess about with. We should be hard-headed in addressing it, and should subject the technologies which attract us to as much scrutiny and rigour as the technologies which repel us.

    It was this process which, after my initial enthusiasm, turned me away from solar power in the UK and led to my reluctant endorsement of large-scale wind and (later) nuclear power as the UK’s most viable sources of low-carbon electricity.

    I wish it were otherwise. But what counts for me is achieving the steepest and fastest possible cut in greenhouse gases. None of our options are great, but these are the best of a bad bunch. (I hope I don’t need to add that we should simultaneously pursue sharp reductions in energy demand).

    Though the costs will keep falling, solar power is unlikely to make a large contribution to electricity supply in the United Kingdom, unless a radically different technology becomes viable. This is because of the inherent constraints I mentioned earlier. It has some potential for mitigating carbon emissions in the summer, especially with the use of smart grids, but it seems to me that for a long time to come there are likely to be cheaper and simpler means of achieving the same aim. I would like to be proved wrong on this, but I don’t think it will happen.

    For all that, looking back across the past three years it seems to me that there is something of the circular firing squad about our duel.

    Two months after we struck our bet, the government changed. I don’t think either of us would have guessed just how bad it would be. In fact it wasn’t until the Any Questions programme two weeks ago that we were able to see how far the madness has gone. Owen Paterson, the environment secretary, revealed that he rejects the science of climate change, and trotted out a series of discredited factoids and myths. This is what he said.

    “the climate’s always been changing, er, Peter [Hain] mentioned the Arctic and I think in the Holocene the Arctic melted completely and you can see there were beaches there – when Greenland was occupied, you know, people growing crops. We then had a little ice age, we had a middle age warming. The climate’s been going up and down, but the real question which I think everyone’s trying to address is is this influenced by manmade activity in recent years and James [Delingpole] is actually correct. The climate has not changed – the temperature has not changed in the last seventeen years …”

    You can read a powerful deconstruction of these claims on the Skeptical Science website.

    Alongside an environment secretary in denial about climate change, we have a chancellor who seems to be attempting to sabotage every green initiative. We see constant efforts by both the press and MPs to prevent the deployment of wind farms. There is a widespread belief in government that the best substitute for natural gas is, er, natural gas, ideally extracted by the most damaging means. We’ve witnessed the abandonment of the energy-saving schemes launched by the last government and their replacement with a useless Green Deal.

    The European Emissions Trading Scheme has collapsed, international negotiations have ground to a halt, CO2 concentrations in the atmosphere have already passed 400 parts per million and there are no serious global efforts to prevent their rise, let alone bring them down. Far from leaving most fossil fuels in the ground – without which no progress on climate change can be made – energy companies and nation states are making unprecedented efforts to extract them from ever more remote and hazardous places.

    In other words, Jeremy and I have both lost. And so has everyone, except the fossil fuel companies.

    So I fire my shot into the air. We differ profoundly on which technologies are best deployed to address climate change. But we confront a government which appears to want none of them, and in this respect we are united.

    www.monbiot.com