1 of 1
|
Why this ad?
Solar power 3kw $2999 – www.spacesolar.com.au – Electricity Prices continue to Rise Get a Solar Now and Save Money!
|
Daily update: The global energy market’s moment of truth
|
Inbox
|
x |
|
2:37 PM (15 minutes ago)
|
|||
|
||||
|
|
||||||||||||||||||||||
|
|
Why this ad?
Solar power 3kw $2999 – www.spacesolar.com.au – Electricity Prices continue to Rise Get a Solar Now and Save Money!
|
|
Inbox
|
x |
|
2:37 PM (15 minutes ago)
|
|||
|
||||
|
|
||||||||||||||||||||||
|
|
Why this ad?
Solar power 3kw $2999 – www.spacesolar.com.au – Electricity Prices continue to Rise Get a Solar Now and Save Money!
|
|
Inbox
|
x |
|
3:03 PM (6 minutes ago)
|
|||
|
||||
|
|
||||||||||||||||||||||||
|
widening of Earth’s tropical belt
Posted in Uncategorized By Neville On March 19, 2014

Recent studies have shown that Earth’s tropical belt — demarcated, roughly, by the Tropics of Cancer and Capricorn — has progressively expanded since at least the late 1970s. Several explanations for this widening have been proposed, such as radiative forcing due to greenhouse gas increase and stratospheric ozone depletion.
Now, a team of climatologists, led by researchers at the University of California, Riverside, posits that the recent widening of the tropical belt is primarily caused by multi-decadal sea surface temperature variability in the Pacific Ocean. This variability includes the Pacific Decadal Oscillation (PDO), a long-lived El Niño-like pattern of Pacific climate variability that works like a switch every 30 years or so between two different circulation patterns in the North Pacific Ocean. It also includes, the researchers say, anthropogenic pollutants, which act to modify the PDO.
Study results appear March 16 in Nature Geoscience.
“Prior analyses have found that climate models underestimate the observed rate of tropical widening, leading to questions on possible model deficiencies, possible errors in the observations, and lack of confidence in future projections,” said Robert J. Allen, an assistant professor of climatology in UC Riverside’s Department of Earth Sciences, who led the study. “Furthermore, there has been no clear explanation for what is driving the widening.”
Now Allen’s team has found that the recent tropical widening is largely driven by the PDO.
“Although this widening is considered a ‘natural’ mode of climate variability, implying tropical widening is primarily driven by internal dynamics of the climate system, we also show that anthropogenic pollutants have driven trends in the PDO,” Allen said. “Thus, tropical widening is related to both the PDO and anthropogenic pollutants.”
Widening concerns
Tropical widening is associated with several significant changes in our climate, including shifts in large-scale atmospheric circulation, like storm tracks, and major climate zones. For example, in Southern California, tropical widening may be associated with less precipitation.
Of particular concern are the semi-arid regions poleward of the subtropical dry belts, including the Mediterranean, the southwestern United States and northern Mexico, southern Australia, southern Africa, and parts of South America. A poleward expansion of the tropics is likely to bring even drier conditions to these heavily populated regions, but may bring increased moisture to other areas.
Widening of the tropics would also probably be associated with poleward movement of major extratropical climate zones due to changes in the position of jet streams, storm tracks, mean position of high and low pressure systems, and associated precipitation regimes. An increase in the width of the tropics could increase the area affected by tropical storms (hurricanes), or could change climatological tropical cyclone development regions and tracks.
Belt contraction
Allen’s research team also showed that prior to the recent (since ~1980 onwards) tropical widening, the tropical belt actually contracted for several decades, consistent with the reversal of the PDO during this earlier time period.
“The reversal of the PDO, in turn, may be related to the global increase in anthropogenic pollutant emissions prior to the ~ early 1980s,” Allen said.
Analysis
Allen’s team analyzed IPCC AR5 (5th Assessment Report) climate models, several observational and reanalysis data sets, and conducted their own climate model experiments to quantify tropical widening, and to isolate the main cause.
“When we analyzed IPCC climate model experiments driven with the time-evolution of observed sea surface temperatures, we found much larger rates of tropical widening, in better agreement to the observed rate–particularly in the Northern Hemisphere,” Allen said. “This immediately pointed to the importance of sea surface temperatures, and also suggested that models are capable of reproducing the observed rate of tropical widening, that is, they were not ‘deficient’ in some way.”
Encouraged by their findings, the researchers then asked the question, “What aspect of the SSTs is driving the expansion?” They found the answer in the leading pattern of sea surface temperature variability in the North Pacific: the PDO.
They supported their argument by re-analyzing the models with PDO-variability statistically removed.
“In this case, we found tropical widening — particularly in the Northern Hemisphere — is completely eliminated,” Allen said. “This is true for both types of models–those driven with observed sea surface temperatures, and the coupled climate models that simulate evolution of both the atmosphere and ocean and are thus not expected to yield the real-world evolution of the PDO.
“If we stratify the rate of tropical widening in the coupled models by their respective PDO evolution,” Allen added, “we find a statistically significant relationship: coupled models that simulate a larger PDO trend have larger tropical widening, and vice versa. Thus, even coupled models can simulate the observed rate of tropical widening, but only if they simulate the real-world evolution of the PDO.”
Future work
Next, the researchers will be looking at how anthropogenic pollutants, by modifying the PDO and large scale weather systems, have affected precipitation in the Southwest United States, including Southern California.
“Future emissions pathways show decreased pollutant emissions through the 21st century, implying pollutants may continue to drive a positive PDO and tropical widening,” Allen said.
Story Source:
The above story is based on materials provided by University of California – Riverside. The original article was written by Iqbal Pittalwala. Note: Materials may be edited for content and length.
Journal Reference:
Robert J. Allen, Joel R. Norris, Mahesh Kovilakam. Influence of anthropogenic aerosols and the Pacific Decadal Oscillation on tropical belt width. Nature Geoscience, 2014;
014 Huffpost Green


Here’s A Lot Of Beefcake In The Name Of Being Kind To Animals

The National Zoo Gave Their Otters A Keyboard To Play With. It’s Fantastic.


It’s Beach Season On The Great Lakes But That Doesn’t Mean The Ice Is Gone

WATCH: About A Dozen Sharks Surround Surfers At Florida Beach. This Is No Movie.


Why These Goalies Are Worried About Unknown Toxins In Artificial Turf


One Of America’s Dirtiest Coal Plants Had Some Dire Predictions. It Was Wrong.


United States flags are displayed on flood-damaged homes in the Breezy Point section of Queens, N.Y., Wednesday, Nov. 28, 2012. (AP Photo/Mark Lennihan)
This story originally appeared on Climate Central.
When Hurricane Sandy struck the Northeast, it was not the storm’s winds but the massive pile of water those winds pushed in front of the storm that wreaked the most havoc, inundating coastal areas in 3 to 9 feet of water, causing billions in damages, and leaving dozens dead. In general, this storm surge poses a far greater threat to lives and property than winds when hurricanes and tropical storms hit.
It’s with this in mind that the National Hurricane Center (NHC) has developed an experimental system that maps the projected storm surge in areas under threat from tropical cyclones — just in time for this hurricane season, which began on Sunday, June 1.
Sandy was no different than most other tropical cyclones, the generic term for hurricanes and typhoons, with the major proportion of its damage caused by storm surge. In the 50-year period from 1963 to 2012, storm surge accounted for nearly half of all tropical cyclone deaths in the U.S., according to a recent study in the Bulletin of the American Meteorological Society. That’s far more than the 8 percent the study attributed to the high winds many assume to be the biggest danger in a hurricane. Yet wind speed continues to be the main measure of a cyclone’s strength, determining when a tropical storm becomes a hurricane and what “category” ranking a hurricane receives.
It’s this unappreciated threat from storm surge that prompted the NHC to begin issuing experimental storm surge flooding maps for all tropical cyclones that threaten U.S. coasts starting with the 2014 hurricane season. The maps will show how high a particular storm’s surge is expected to get in different areas and how far inland it could go.
“This is a really desperately needed update,” said Jamie Rhome, a storm surge specialist with the NHC who is heading the mapping effort.
Adding to the need for such a warning mechanism is the fact that the population along coastal areas has been rising, putting more people in harm’s way. And rising sea levels — the result of the ocean warming and ice melting due in part to warming global temperatures — are increasing the storm surge threat. Some research has also suggested that Atlantic basin storm could become more intense, if less frequent, which could effect the level of storm surge coastal communities experience.
While Sandy brought threat of storm surge to the public’s attention, it was an earlier storm that jump-started the NHC’s efforts to produce inundation maps: Hurricane Ike, which hit Galveston, Texas, on Sept. 13, 2008, as a Category 2 hurricane and brought storm surge that reached 15-20 feet above normal tides.
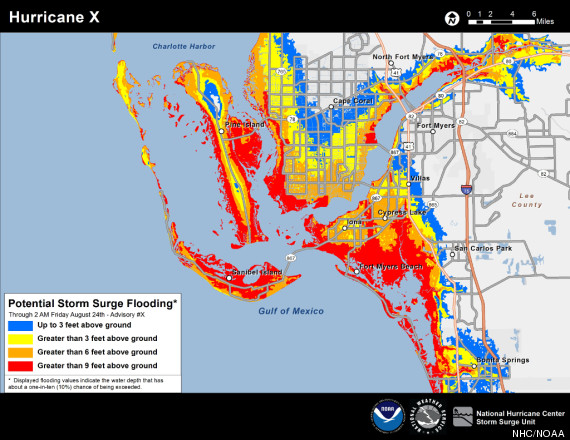
An example of a new storm surge mapping tool unveiled by the National Hurricane Center as an experimental product during the 2014 season. This map shows how a hypothetical Hurricane ‘X’ might impact Ft. Myers, Fla., with different levels of storm surge color coded. Credit: NHC/NOAA
Rhome said that the effort began shortly after Ike, when social scientists were brought in to help run focus groups and tell the hurricane researchers what kind of tool would be most useful to the public. Based on that feedback, Rhome and his team spent the last few years refining the maps.
Sandy just “shined a big spotlight on the project” and helped expedite its release, Rhome told Climate Central. Recent advances in computer models and the growing availability of detailed topographical data, both critical for telling how high waters could rise, have also helped bring the project to fruition and the resulting maps will now be tested over the next two hurricane seasons.
Each map will show the area under threat from storm surge, with color-coded ratings showing how high the water could get above the ground in different areas. The scale runs from blue to red and represents water rising anywhere from up to 3 feet to more than 9 feet above ground.
The maps are based on several factors including how big the incoming storm is, its intensity, and the track it is expected to take since winds on the right side of a storm will push water toward shore, while the winds on the left side will push it away. The ratings also take into account astronomical tides and the elevation of the land under threat.
Maps will be issued for a given storm when a hurricane watch or warning is issued, and in some cases for a tropical storm watch or warning, when any place along the U.S. Gulf or East Coast is under threat.
Throughout the two-year experimental run, Rhome and his colleagues will see how the maps perform in showing where the surge actually occurs. And if the season is as uneventful for the U.S. as it was in 2013? Then the team will create “fake” storms to see what the models predict.
“There’ll still be ways to test it,” Rhome said.
Rhome and his team will also be looking for feedback from officials and the public. The NHC has a survey set up on its site where users can leave comments.
So far, the feedback “has been incredibly if not overwhelmingly positive,” Rhome said.
Also on HuffPost:

Posted 2 hours 23 minutes ago
People who have to sell their house to fund their aged care could end up paying higher fees than those who can afford to keep their home, under an overhaul of the system beginning next month.
The changes, announced by the former Labor Government two years ago and broadly agreed to by the Coalition, mean that from July, daily care fees at nursing homes will be means tested on assets and income, rather than just income.
Crucially, the family home will be included in the means test if a spouse or dependent child doesn’t live in it, but its value will be capped at $154,179.
Those who are forced to sell their home will have the proceeds of the sale subject to a means test.
The changes will not affect anyone already in residential care, but are likely to mean that for most home-owning pensioners, aged care fees will be higher if they enter care after July, than before.
Work by specialist in aged care planning, financial planner Simon Boylan, from Zenith Financial Planning, shows one scenario, where someone with a $600,000 home could end up paying a higher means tested fee than someone with a $3 million home (see table).
“Because the assessable value of the home is going to be capped at $154,179, those who can afford to hang onto their home may well pay lower means tested fees than those that have to sell in order to fund their accommodation, because their assets won’t be capped,” he said.
| Case A – sells house | Case B – keeps house | |
|---|---|---|
| Value of house | $600,000 | $3 million |
| Value of house that is means-tested | $600,000 | $154,179 |
| Pension | $19,040 | $21,913 |
| Savings | $200,000 | $400,000 |
| Nursing home bond | pays all of $500,000 bond upfront | pays $400,000 of $500,000 bond upfront |
| Annual means-tested aged care fee | $12,169 | $5,817 |
| Source: Zenith Financial Planning: Figures used as an example only. Seek advice regarding your individual circumstances. | ||
A leading aged care provider says the new system is inequitable and the government should address it.
“It’s not a level playing field,” says chief executive of HammondCare, Stephen Judd.
“It will tend to be the people that have got a more expensive house that’ll say ‘no, I’ll keep that, and only a small amount of it’s counted towards my assets’. Whereas if people have a less expensive house, they’ll be obliged to sell that and that will be counted towards their assets.
“That’s an inequity which I think needs to be ironed out.”
In its Aged Care report in 2011, the Productivity Commission recommended means testing the family home for aged care fees, but did not recommend a cap.
Assistant Social Services Minister, Mitch Fifield, says the government has no plans to change the cap.
“[Historically], we have treated the residential home as a different and special sort of asset,” he said.
“We think it’s important to let the reforms that are coming through on the first of July bed down, I think consumers and providers want as much certainty and continuity as possible.
“We do have legislated a five year review of these aged care reforms and we’ve also appointed an aged care steering committee, which will be looking at the next steps for reform, but at the moment we don’t have any plans to change the arrangements.”
Mr Fifield says the reforms will see more transparency and choice in the system, as aged care facilities now must publish their fees on their websites and in other publications, as well as on the www.myagedcare.gov.au website, and residents will be able to decide if they want to pay upfront or at a daily rate, or a combination of both.
|
Why this ad?
Windows 7 Driver Download – www.windows-7.driverupdate.net – Windows 7 Drivers Latest Download. Microsoft Certified. (Recommended)
|
|
Inbox
|
x |
|
5:05 PM (18 minutes ago)
|
|||
|
||||
Monbiot.com |
| Homesick
Posted: 02 Jun 2014 12:37 PM PDT The point of current housing policy is to sustain a system built on injustice.
By George Monbiot, published in the Guardian 3rd June 2016 There is no shortage of explanations, and no shortage of solutions. But the problem that lies behind our multiple housing crises is simple and obvious. It is, at root, a failure to tax. Another record tumbled last week. In April, we discovered, house prices in London rose by 4.2%: the largest monthly rate in British history(1). Young people must mortgage their working lives to service the profits of those who got there first. As Professor Danny Dorling notes in his book All That Is Solid, “no other city in the developed world contains such a deep – and growing – chasm between rich and poor”(2). No other city “is surrounded by an entire region where the average house price exceeds £200,000″. Yet our capital contains the largest number of people in poverty of any city in western Europe. If you buy, you are sucked into a vortex of debt and insecurity. If you don’t, you are forced into a rental market of Dickensian cruelty. Rents in this captive market rose by 9% in London in 2012, while median earnings rose by 2%(3). Landlords possess the kind of power once wielded by Norman barons. They let out properties that would make great homes for frogs (damp, cold, plenty of insects). If you complain you run the risk of a revenge eviction(4,5). The profits are amazing: an average of 16.3% on a buy-to-let mortgage over the past 18 years(6). Last year the Daily Mirror introduced us to a man called Charles Gow(7). He is the son of Ian Gow: a Conservative housing minister who presided over Mrs Thatcher’s policy of selling council houses to their tenants at massive discounts. Charles Gow now owns with his wife at least 40 former council flats on just one estate in south London. When he started buying, in 1996, they were worth £100,000 each. Now they are valued at £300,000 or more, and he rents them out for £1,500 a month. You can judge the extent to which ours has become a rentier economy by the furious response to Ed Miliband’s timid proposals to regulate letting(8). “Venezuelan-style rent controls”, said the Conservative party chairman, Grant Shapps(9). “The most stupid and counter-productive policy that we have seen from a mainstream party leader for many years”, stomped Stephen Pollard for the Daily Mail(10). While Miliband’s proposals would be of some use, they ignore the underlying problem: a consistent failure to tax property progressively and strategically. The United Kingdom is remarkable in that it imposes no land value tax(11); no capital gains tax on principal residences(12); and charges council taxes that appear to be the most regressive major levies of any kind, anywhere in western Europe. The only capital tax on first homes is stamp duty, but that recoups a tiny proportion of their value when averaged across the years of ownership(13). Remarkably, it is imposed on the buyer, not the seller. Why should capital gains tax not apply to first homes, when they are the country’s primary source of unearned income? Why should council tax banding ensure that the owners of cheap houses are charged at a far greater relative rate than the owners of expensive houses? Why should Rinat Akhmetov pay less council tax for his £136m flat in London than the owners of a £200,000 house in Blackburn?(14,15) Why should second, third and fourth homes not be charged punitive rates of council tax, rather than qualifying, in many boroughs, for discounts?(16) The answer, of course, is power: the power of those who benefit from the iniquities of our property market. But think of what fairer taxes would deliver. House prices have risen so much partly because all the increment accrues to the owner. Were the state to harvest a significant part of this unearned income, it would hold prices down and dampen speculative booms. A land value tax would penalise the owners of empty homes: the resulting rise in supply would also help to suppress prices. The money the state recouped could be used to build affordable housing. Perhaps the most useful tax would be a levy on under-occupancy. In 2011, I proposed a kind of bedroom tax for the private sector: owners with two spare bedrooms or more should be subject to higher property taxes(17). This was after I stumbled across some buried government figures showing a 45% increase (to nearly 8 million) in the number of under-occupied homes in England in just six years(18). An under-occupancy tax would encourage people either to sell houses that were bigger than they needed to families that could make better use of them, or to divide them, or to take in lodgers. The howls of execration from the right-wing press still ring in my ears. A columnist in the Telegraph described my idea as “far closer to fascism than the ethno-centric populism of the European radical Right”(19). But when, the following year, the government introduced a bedroom tax aimed not – like mine – at rich owners, but at poor tenants, and with a lower threshold (one spare bedroom, not two), there arose from the same quarters a genteel murmur of approbation. Now Danny Dorling reveals that “the supply of dwellings and especially rooms per person has never been higher”(20). What we are faced with, he says, is not a crisis of supply but a crisis of distribution. In England and Wales there are 55 million people and 66 million bedrooms: if no one shared a room there would still be more than enough. Even in London there are more bedrooms than people: a greater supply of housing per head than there has ever been. But because inequality has been expanding even faster than extensions and conversions, most of this abundance of space is in the hands of the people who need it least. A well-aimed tax would help to match housing to need – and would doubtless prompt a major reassessment of how much new building is really required(21). When an obvious answer is ignored or repudiated by almost everyone, you see that this is a problem which is not supposed to be solved. The government’s measures – Help to Buy, less planning control, incentives for landlords – are not intended to accommodate those in greatest need. They accommodate the injust system that keeps them there. Disclosure: I own a house, in mid-Wales, which I rent to a housing co-op, composed of five people. I bought it for £278,000 in 2007 and spent a little over £100,000 renovating it. The rent is £9,480 a year. I live in someone else’s house, in which I have no equity. I have no other property. There is a full registry of my interests here. References: 1. http://www.theguardian.com/money/2014/may/30/london-house-prices-april-record 2. Danny Dorling, 2014. All That Is Solid: The Great Housing Disaster. Penguin, London. 3. Danny Dorling, 2014. All That Is Solid: The Great Housing Disaster. Penguin, London. 4. http://www.independent.co.uk/property/200000-face-revenge-evictions-by-landlords-9186776.html 5. http://www.theguardian.com/money/2014/may/02/tenant-evicted-hot-water-landlord-wilson 6. http://www.theguardian.com/commentisfree/2014/apr/29/rent-tenants-private-landlords-power-regulation 7. http://www.mirror.co.uk/news/uk-news/right-to-buy-housing-shame-third-ex-council-1743338 8. http://www.theguardian.com/politics/2014/apr/30/ed-miliband-labour-rental-market-reforms-property 12. http://www.hmrc.gov.uk/cgt/property/sell-own-home.htm 13. https://www.gov.uk/stamp-duty-land-tax-rates 14. http://www.theguardian.com/commentisfree/2014/mar/29/why-do-we-pay-more-council-tax-than-knightsbridge-oligarchs 16. https://www.gov.uk/council-tax/second-homes-and-empty-properties 17. http://www.theguardian.com/commentisfree/2011/jan/04/take-housing-fight-wealthy 20. Danny Dorling, 2014. All That Is Solid: The Great Housing Disaster. Penguin, London. 21. http://www.theguardian.com/commentisfree/2014/may/21/no-housing-crisis-just-very-british-sickness |
| Y |