Author: Neville

  • Antarctic Riddle: How Much Will the South Pole Melt?

    Antarctic Riddle: How Much Will the South Pole Melt?

    • Published: August 25th, 2014
     1553  591  866  3

    One of the biggest question marks surrounding the fate of the planet’s coastlines is dangling from its underbelly.

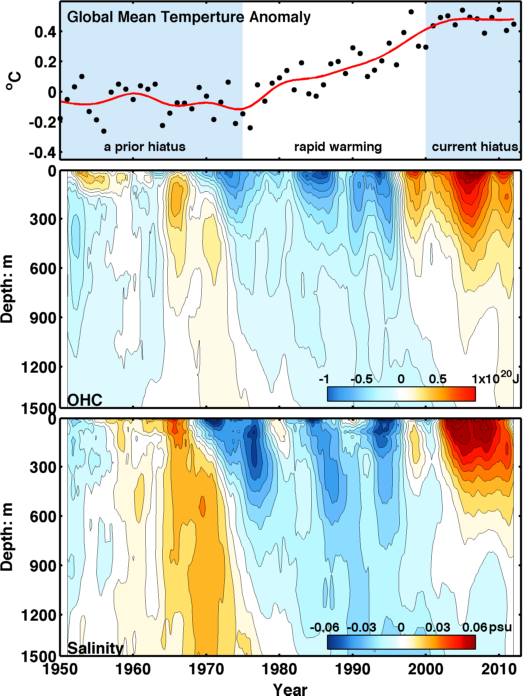
    The melting of the Antarctic ice sheet has long been a relatively minor factor in the steady ascent of high-water marks, responsible for about an eighth of the 3 millimeters of annual sea-level rise. But when it comes to climate change, Antarctica is the elephantine ice sculpture in the boiler room. The ice sheet is so massive that its decline is, according to the recent Intergovernmental Panel on Climate Change assessment, “the largest potential source” of future sea level rise. Accurately forecasting how much of it will be unleashed as seawater, and when that will happen, could help coastal communities plan for surging flood risks.

    Credit: Peter Doran/National Science Foundation

    A study published Aug. 14 in Earth System Dynamics — one that took more than 2 years and 50,000 computer simulations to complete, combining information from 26 atmospheric, oceanic, and ice sheet models from four polar regions — has helped scientists hone their forecasts for this century’s Antarctic thaw. And the results of the global research effort were more sobering than the findings of most of the more limited studies that came before it.

    The world’s seas could rise anywhere from less than half an inch up to more than a foot by the end of this century solely because of the effects of balmier waters fanning Antarctica’s underside, causing ice to melt, icebergs to calve, and ice and snowpack to slough into the sea, the scientists calculated. The upper limit of that projection is more than double earlier estimates, with scientists attributing the change to advances in models.

    “The largest uncertainty that we have with regards to Antarctica is, how much of the warming reaches the continent through the ocean, and how much melting does it cause?” said Potsdam Institute for Climate Impact Research’s Anders Levermann, who led the study. Levermann was also a lead author of the sea level rise chapter in the most recent IPCC assessment.

    Those figures do not include additional sea level rise caused by melting glaciers, by the melting of the Greenland ice sheet, by the expansion of warming water, or from the effects of groundwater pumping, which shifts water from aquifers to the seas. If the most recent IPCC projections for those sources of rising seas were combined with the new Antarctic figures, the U.N. group’s upper limit for overall sea level rise by century’s end would increase to 119 cm, or nearly 4 feet. That’s up by more than a fifth compared with the figure included in last year’s assessment.

    RELATED Melt of Key Antarctic Glaciers ‘Unstoppable,’ Studies Find
    Newfangled ‘Icepod’ Tracks Greenland’s Melting Ice Sheets
    Winds of Change: Why Antarctic Sea Ice Is Growing

    That’s a lot of water. For comparison, seas have risen about 8 inches since the turn of the 20th Century, as temperatures have risen by 1.5°F, due primarily to the burning of fossil fuels. That has increased rates of flooding across coastal U.S. and driven some Pacific Islanders to seek asylum in foreign lands. The hastening pace of sea level rise threatens to reshape the lives of more than a billion coastal dwellers and imperils potentially tens of trillions of dollars worth of infrastructure.

    Of course, upper limits are just that — they represent the highest levels of sea-level rise for which science currently says coastal planning departments should brace. “It’s this upper limit that’s important for coastal planners,” said Levermann.

    But rising upper limits come with rising median projections, which, by definition, have a 50 percent likelihood of being surpassed. Median projections produced through the new study suggest a rise of several inches is likely due to Antarctic melt alone.

    The vast range of lower and upper limits for sea level rise caused by Antarctic ice-sheet melting that were included in the new paper — more than a foot — were partly the result of uncertainty over how much greenhouse gas pollution the world will churn out during the coming decades. The upper limit assumes that annual greenhouse gas emissions continue to increase. But it also reflects the vast uncertainty in ice sheet and other models that were combined to simulate Antarctic melting.

    Credit: wikipedia

    “A reason for our higher SLR [sea level rise], and for the range in SLR, is that the present study also includes the uncertainty in the climate and ocean forcing driving the ice sheet models of Antarctica,” said Sophie Nowicki, a NASA Goddard scientist who coauthored the new paper. “In other words, more potential climatic futures are considered.”

    The melting of the other great ice sheet, which blankets Greenland, is driven largely by rising air temperatures. Those processes can be difficult to understand. But the processes that melt the Antarctic ice sheet are even more convoluted. Antarctica is further from the equator than is Greenland, which keeps the air frigid even in summer, shielding most surface ice from melting. Unlike in Greenland, much of the Antarctic ice sheet is submerged below sea level, causing it to melt from beneath and crumple into the sea as oceans absorb heat that’s accumulating the atmosphere.

    Antarctica’s ice sheet is more than a mile deep on average, holding enough water to raise sea levels 200 feet should it all melt. That means the southern ice sheet has more potential to flood the world than does its boreal counterpart — although the Antarctic melt is taking longer to kick into gear.

    The melting of the two ice sheets was responsible for a third of sea level rise from 2002 to 2011, according to numbers in the recent IPCC report. The Antarctic ice-sheet melt caused about 40 percent of that; Greenland’s ice-sheet caused 60 percent. The melting of the ice sheets are playing growing roles in coastal floods.

    It seems that the more we learn about the forces that cause ice sheets to melt, the more vulnerable we realize they are to wither. The IPCC cited “improved modeling” when it raised its forecasts for sea level rise in its recent report, compared with the projections it published in 2007.

    Natalya Gomez, a post-doctoral fellow at the Courant Institute of Mathematical Science at New York University who researches ice sheet and sea level interactions, says the numbers published in the new paper are “not the final answer.” Gomez says they will continue to be refined in the coming years as ice-sheet models and other models continue to improve. She warns that the sea level rise projections could increase even further as models evolve.

    The beauty of the new work, says Gomez, who was not involved in the research, lies in the fact that the scientists behind it have developed a tool that will propel a nascent and challenging field.

    “What they’re assessing — the range of possible responses of the Antarctic ice sheet to future warming — is really challenging,” Gomez said.

    You May Also Like:
    A Tale of Two Cities: Miami, New York and Life on the Edge
    Warming Puts Emperor Penguins at Risk of Extinction
    The Bad News Continues to Flow About Antarctica’s Ice
    Massive Iceberg Breaks off Pine Island Glacier in Antarctica
    Soaring Temps in West Antarctica May Fuel Sea Level Rise

  • Why the World Needs to Shut Down Coal-Fired Power Plants Faster Than EverWhy the World Needs to Shut Down Coal-Fired Power Plants Faster Than Ever

    Why the World Needs to Shut Down Coal-Fired Power Plants Faster Than Ever

    Scientists find that existing fossil fuel power stations will emit 300 billion tons of carbon over the next few decades, and the problem is only getting worse.

    (Photo: Donald Chan/Reuters)

    August 27, 2014 By

    Kristine Wong is a regular contributor to TakePart and a multimedia journalist who reports on energy, the environment, sustainable business, and food.

    full bio follow me

    A new study has found that the world’s existing fossil fuel power plants will spew more than 300 billion tons of carbon dioxide into the atmosphere over their four-decade life span.

    That’s more than 20 percent of the Earth’s carbon budget of 1,400 billion tons—the highest level of carbon dioxide that scientists believe can be emitted and not raise the global temperature beyond the threshold of 2 degrees Celsius agreed to at the 2009 United Nations climate talks in Copenhagen.

    It may seem strange that nobody thought to count this before, but the study is the first worldwide tally of carbon emissions from power plants by accounting for future emissions, also known as committed emissions.

    “Our study shows that despite international efforts to reduce CO2 emissions, total remaining commitments in the global power sector have not declined in a single year since 1950 and are growing rapidly—by an average of 4 percent per year from 2000 to 2012,” said Steven Davis, an earth sciences researcher at the University of California, Irvine, and the coauthor of the paper, published this week in the journal Environmental Research Letters.

    In contrast, annual carbon emissions from existing power plants grew by 3 percent over the same period, meaning the world is still building more fossil fuel power plants than it’s mothballing.

    Here’s an example of this differential: While the power plants built in 2012 alone are projected to release 19 billion tons of carbon over their 40-year lifetime, the CO2 emissions that year from all the power plants already operating at that time was 14 billion tons.

    “We’re taking on more debt than we’re paying, so the balance is growing—and that’s disturbing,” Davis said.

    The results improve on current data used by the U.N.’s Intergovernmental Panel on Climate Change, which has incorporated estimates about the number of new power plants into their emissions scenario models, according to Davis.

    Why hasn’t the analysis been done before?

    “It’s a data-intensive process, and only recently has there been more access [to information],” Davis said, who used data from Platt’s, a company that collects information about the energy industry.

    His research team also conducted an analysis of where new power plants are coming online. While the United States is retiring more power plants than it’s building, the European Union is bringing them online at the same rate that it’s taking them offline, according to Davis.

    “But in China, India, Indonesia, Iran, and Saudi Arabia, there’s been a lot of coal-fired power plants—it’s been as high as four times more commitments in any given year versus what they’re emitting right now,” he said. “That’s like charging $400 [on a credit card] in any given month and only paying $100.”

    But since 2010, China has slowed construction of coal-fired power plants, while Southeast Asia has been building more to expand its industrial capacity, Davis noted.

    He is working on estimating future emissions from the power plants that came online in 2013, noting that such a tally should be done annually to incorporate the latest data available.

    In the meantime, his 2012 results have gotten the attention of IPCC scientists in Vienna, with whom he’ll be collaborating to develop a new carbon emissions scenario based on his findings. Davis has also been in contact with the U.S. State Department about the results.

    In December, he’ll be presenting at the next U.N. climate talks, which are scheduled to take place in Lima, Peru.

    “I’d say these commitments are growing so rapidly that they’re in line with that worst-case emissions scenario presented by the IPCC,” he said, referring to a world where carbon emissions continue to grow past the year 2100.

    Related Stories on TakePart

  • The Greenhouse Gas Emissions Profile of Coal Bed Methane (CBM) Production: A Review of Existing Research John Broderick, Maria Sharmina

    eScholar Services

    Supported by The University of Manchester Library

    The Greenhouse Gas Emissions Profile of Coal Bed Methane (CBM) Production: A Review of Existing Research

    John Broderick, Maria Sharmina

    Manchester: University of Manchester; 2014.

    Access to files

    Abstract

    This report offers an overview of greenhouse gas emissions profile of coal bed methane production from the existing academic and grey literature. It does not provide any new empirical evidence although additional calculations have been performed to allow for comparison between studies and with data for other sources of natural gas. Having examined the available literature, the report identifies where there are gaps that are relevant to UK development of CBM.

    Bibliographic metadata

    Type of resource:
    Content type:
    Publication date:
    Place of publication:
    Manchester
    Total pages:
    13
    Abstract:
    This report offers an overview of greenhouse gas emissions profile of coal bed methane production from the existing academic and grey literature. It does not provide any new empirical evidence although additional calculations have been performed to allow for comparison between studies and with data for other sources of natural gas. Having examined the available literature, the report identifies where there are gaps that are relevant to UK development of CBM.

    Record metadata

    Manchester eScholar ID:
    uk-ac-man-scw:225295
    Created by:
    Broderick, John
    Created:
    15th May, 2014, 12:50:32
    Last modified by:
    Broderick, John
    Last modified:
    20th August, 2014, 12:08:47
  • Warming waters threaten to trigger methane eruptions from Arctic Ocean seafloor

    Posts    FAQ    Myths    About    Contact    Tweets    Quotes    Videos    Links    Plan

    Saturday, August 30, 2014

    Warming waters threaten to trigger methane eruptions from Arctic Ocean seafloor

    K. Tung / Univ. of Washington. (Top) Global
    average surface temperatures, where black dots
    are yearly averages. Two flat periods (hiatus)
    are separated by rapid warming from 1976-1999.
    (Middle) Observations of heat content, compared
    to the average, in the north Atlantic Ocean.
    (Bottom) Salinity of the seawater in the same
    part of the Atlantic. Higher salinity is seen
    to coincide with more ocean heat storage.

    A new study looks at how, in the 21st century, surface warming slowed as more heat moved deeper into the oceans, specifically the North Atlantic.

    Sun-warmed salty water travels north along ocean currents in the Atlantic. When this saltier water reaches the North Atlantic, its greater density causes it to sink. From about 1999, this current began to speed up and draw heat deeper into the ocean.

    These huge amounts of heat moving deeper into the Atlantic Ocean are very worrying.

    The image below shows that sea surface temperatures have reached extremely high levels on the Northern Hemisphere, where sea surface temperature anomalies as high as 1.78 degrees Celsius were recorded on August 19, 2014.

    As discussed in an earlier post, water carried by the Gulf Stream below the surface can be even warmer than surface waters. As the post discusses, high sea surface temperatures west of Svalbard indicate that the Gulf Stream can carry very warm water (warmer than 16°C) at greater depths and is pushing this underneath the sea ice north of Svalbard. Similarly, warm water from greater depth comes to the surface where the Gulf Stream pushes it against the west coast of Novaya Zemlya.

    Very warm water is now invading the Arctic Ocean through the Bering Strait from the Pacific Ocean, while very warm water is also traveling on the back of the Gulf Stream from the North Atlantic into the Arctic Ocean.

    The danger is that this warm water will destabilize hydrates contained in sediments under the Arctic Ocean and trigger huge methane eruptions.

    Rising methane levels over the past few years are ominous in this respect. The image below shows very high mean global methane levels on August 28, 2014, while methane readings as high as 2561 ppb were recorded on that day.

    Methane Levels –  see earlier post for a discussion of IPCC/NOAA data

    In conclusion, the situation is dire and calls for comprehensive and effective action, as discussed at the Climate Plan blog.

    References and Related Links

    – Varying planetary heat sink led to global-warming slowdown and acceleration
    by Xianyao Chen and Ka-Kit Tung.
    http://www.sciencemag.org/content/345/6199/897

    – Cause of global warming hiatus found deep in the Atlantic Ocean
    University of Washington News Release
    http://www.washington.edu/news/2014/08/21/cause-of-global-warming-hiatus-found-deep-in-the-atlantic-ocean

    – Horrific Methane Eruptions in East Siberian Sea
    http://arctic-news.blogspot.com/2014/08/horrific-methane-eruptions-in-east-siberian-sea.html

    – Methane Buildup in the Atmosphere
    http://arctic-news.blogspot.com/2014/04/methane-buildup-in-atmosphere.html

    – Climate Plan blog
    http://climateplan.blogspot.com

  • Solar power storage solutions: Beyond batteries

    Solar Choice

    The development of affordable storage solutions for solar power or other renewable energy sources such as wind will change the nature of electricity generation and distribution as we know it. Most people think of wind and solar power storage (usually in the form of batteries) as a technology primarily for use in off-grid/stand-alone solar power systems. However, a growing number of companies are now offering increasingly intelligent solar power management and storage solutions–both for the residential and commercial solar power markets.

    Smart storage technologies for grid-connect and off-grid solar power

    The future of electricity generation is likely to veer away from the current model of centralised power production and distribution. Renewable energy technologies such as rooftop solar, which can be connected in a decentralised, ‘distributed’ way throughout the electrical grid, have the potential to transform the way we think about and generate power, with massive potential savings in store for homes, businesses, and electricity generation/transmission infrastructure as a whole.

    Battery banks: traditionally for off-grid solar power systems

    Traditionally, battery banks have been a technology only used primarily in solar power systems that are not connected to the electrical grid. The reason for this is fairly obvious: Off-grid homes need reliable power even at night, and solar panels are generally the most cost-effective way to generate it, but cannot provide on-demand power unless the sun is shining, which may not necessarily be when it is needed most. The solution is therefore to capture it in batteries which can then be drawn upon later to provide power.

    With grid-connected solar systems (which are these days by far the more numerous type), batteries are not necessary because the electricity grid functions as a kind of bottomless battery bank. Additionally, the cost of storage technology can be prohibitively high (although this is changing), making it quite unattractive for those who have the option to simply buy relatively cheap electricity from the grid. This dynamic is changing, however, with the price of retail electricity rising across Australia, and the price of solar PV systems also dropping rapidly.

    Why opt for power storage with a grid-connected solar PV system?

    It is helpful to think about a battery bank for an off-grid system as equivalent to the electricity grid for a grid-connect system. Due to the the individualised nature of battery banks (as well as the comparatively small scale of their industrial production), it is not yet possible for them to achieve the economies of scale that enable grid power to reach its relative level of affordability. This is why most households and businesses with grid-connect solar power systems don’t bother to install battery banks–when it’s more affordable to simply purchase power from the grid, why would anyone bother to opt for a storage system?

    Having a battery bank for a grid-connect system only makes sense if there is a way that the battery bank can be drawn on when it is advantageous for the system owner–usually during electricity peak rate periods of the day, when grid power is at its most expensive and the sun is not shining. Taking this factor into consideration creates a more complex dynamic than the traditional off-grid system, where the inverter-charger/system manager ordinarily needs only to ‘choose’ between solar power or the battery bank. In order to get the most out of a grid-connect system that also has an energy storage system (as distinguished from a simple battery bank for an off-grid system), however, the management software has to be ‘smarter’ and–ideally–programmable.

    Why programmable? Incentives for solar power generation differ from state to state in Australia, encouraging different patterns of electricity consumption timing. For example, if you have a grid-connected solar system in a state with a generous Solar Feed-in Tariff such as Queensland, it will make the most financial sense for you to export as much of your solar power as possible, whereas in a state with virtually no Solar Feed-in Tariff incentive (such as NSW), it makes more financial sense to self-consume as much as your solar power as possible, because allowing it onto the grid would be something of a ‘waste’. An intelligent, programmable storage system will give you the greatest amont of control over the use of the energy that you produce and store at home or in your business, allowing you to make sure that you’re using it in the most economically advantageous way possible.

    How do solar power storage solution technologies work?

    The number of solar power storage solution technologies available in Australia is limited but growing. Each one functions in a slightly different way, but the basic principle is the same: solar power can be collected in batteries for later use or to be fed into the grid, depending on the incentives. Solar power storage devices are generally comprised of a battery bank (utilising a technology such as standard-issue lead-acid or the increasingly affordable lithium-ion) and a smart inverter that can manage power in accordance with programming.

    The capacity of storage devices can vary by both the brand and the model of the product in question. It may even be the case that the ‘management’ portion of the technology is sold separately to the storage portion. Conventional battery banks for off-grid systems can basically be built and expanded to meet expected demand, and are managed by inverter-chargers. This can also be true of some grid-connect storage units, but generally speaking there is no reason to put together a system that will be able to supply a home or business with electricity for 3-5+ days, as may be required with an off-grid system. Instead, the surplus storage is used as a ‘buffer’ to protect the home or business from higher electricity prices, so in most cases enough storage capacity for 10-15 hours’ worth of power, depending on how it is used. Of course larger storage systems may also be used as power back-ups for systems in locations where grid reliability is shaky, or for institutions such as hospitals who need to remain fully operational even when the grid fails.

    Interestingly, grid-connect energy management/storage technologies need not necessarily even be attached to a distributed generation unit such as a solar PV system. Connection to the grid means that the grid can be used as a ‘generator’, and cheap, off-peak power can be used to charge up batteries and then consumed during peak periods when grid electricity is expensive. Where there is a Feed-in Tariff agreement in place, it would also be possible for a home or business to feed the stored electricity back into the grid and receive a premium payment for it–yet another opportunity to save money on electricity bills.

    What to look for in a grid-connect solar storage system

    While solar power systems are rated in kilowatts (kW), electricity storage capacity is measured in either ampere-hours (Ah, a measure commonly used in off-grid system battery banks) or kilowatt-hours (kWh, the same measure used in power bills to calculate electricity consumption as well as production). The level of storage capacity that you require will depend on how you plan to plan to use your power–simply as a back-up, or to maximise power bill savings? A useful way to look at the price of a storage unit is the price per kWh (as opposed to solar generation units, whose price is usually measured in cost per kilowatt).

    The lifespan of the battery component of a solar storage/management technology is usually measured in ‘cycles’. Batteries used in storage systems are called ‘deep-cycle’ batteries, and can be routinely discharged to as low as a certain percentage of their capacity–e.g. 50% or 20% (as opposed to car batteries which need to stay closer to 100% in order to function properly). Essentially, a cycle is one round of completely discharging a fully charged battery, but in practice this is avoided as much as possible, because repeated discharges this ‘deep’ can shorten the lifespan of the battery, especially for the most common and affordable battery technology available: lead-acid batteries. The second most common type of battery commercially available is the lithium-ion battery, which can be discharged more deeply a greater number of times, but still remains significantly more expensive than lead-acid, although this is changing as technology improves, aided in great part by the global development of an electric vehicle market.

    In theory, storage systems should be able to utilise any type of electricity storage device that you can think of–including fuel cells. However, fuel cells have not reached the level of reliability or affordability that the two battery technologies mentioned above have. It may only be a matter of time, however, before fuel cells are worked into an off-the-shelf power storage solution. Similarly, it may also become possible for an electric vehicle to double as a power storage device, provided the system’s power management component is capable of operating it as such. (A company called Better Place has aimed to do just this.)

    What solar power storage technologies are commercially available in Australia?

    Power Router Diagram

    Power Router Diagram (Image via Nedap)

    One option available on the Australian market at the time of writing is the Netherland’s Nedap’s PowerRouter, whose modular nature allows for smart management of a small-scale renewable energy system as well as a battery bank if necessary.

    Another product soon to be available (from June 2012) is an Australian-made module from a prominent South Australian solar installation company.  This unit is unique for a number of reasons. It is a totally self-contained energy management and storage unit that extends battery life by ‘balancing’ them, drawing on batteries as individual units–as opposed to the conventional arrangement of a ‘bank’ of batteries strung together–and thus eliminating the ‘weakest link’ syndrome that battery banks are notoriously susceptible to.

    How distributed grid-connect power storage could change the nature of electricity generation, distribution, and renewable energy

    One of the main objections to the broad-scale uptake of renewable energy technologies is the issue of intermittency–solar technologies only produce power when the sun is shining, wind power only generates when the wind is blowing. This is in contrast to coal and gas generation (among others), which can be ramped up and down on demand. Although there have been a number of proposed fixes to the intermittency issue (such as highly detailed weather forecasting), widespread distributed storage could be a game-changing solution that few people could have seen coming even a few years ago. The idea is gaining traction internationally (below is a video of one new proposed technology that could change everything), and it may only be a matter of time before it becomes something that we all take for granted, like we all do our current generation infrastructure.

    Top image via Nedap

    © 2012 Solar Choice Pty Ltd

  • German report outlines vision for 100% renewable power

    German report outlines vision for 100% renewable power

    By on 26 August 2014
    Print Friendly

    Renewables International

    The results of a three-year project investigating what a purely renewable power supply would look like have been published. The findings could be a roadmap for the coming years bar unforeseen technical breakthroughs.

    wwf

    Source: WWF

    The visualization is nothing short of astonishing – see for yourself. And if you don’t speak German, you might want to use two screens, one with that website and one with this one because all I am going to do today is show you how to navigate the interactive graphics. In a future post, hopefully tomorrow, I will take a look at some of the underlying assumptions.

    Basically, we are looking at an hour-by-hour extrapolation of current data for a future scenario with a 100 percent renewable power supply. The project is called “combined power plant” (Kombikraftwerk), a sort of virtual power plant consisting of solar, wind, and biomass with ancillary storage & generation facilities, control technology, and power lines. We originally wrote about the project briefly last year.

    Back to the visualization – the map on the left shows you where what happens, and you click on the start button at the bottom left to go through the entire year hour by hour. If you press stop, you can also go through manually by hour (Stunde) or day (Tag), with vorherige(r) and nächste(r) meaning previous and next.

    At a rate of around two scenario hours per real-time second, it will take you more than an hour to view the entire year, so the bar at the bottom (scroll down if you can’t see it right away) is your friend. Use it to see, for instance, how solar pops up in the summer relative to wind in the winter.

    Over on the right, the chart shows the kind of flows in power production that my readers are used to seeing from Agora and thrown over data. Above the baseline, we have power production; below it, power consumption. The legends are as follows:

    Generation Consumption
    Excess Households
    Imports Industry
    Offshore wind Grid losses
    Onshore wind Power-to-gas
    Photovoltaics Batteries
    Bioenergy Pumped storage
    Biomethane Exports
    Batteries
    Pumped storage
    Green methane
    Hydropower
    Geothermal


    At the bottom, we see a legend with the two circles for the map chart. When more power is consumed locally, a blue circle appears, and there is even a breakdown of the power source: yellow indicates solar, blue wind power, green bioenergy, and white other. When more power is consumed in that particular area, the circle is red. The larger the circle, the more power is being generated/consumed. When the circle is especially red, a lot of power is being consumed without much being produced at that location.

    You will also notice some lines connecting the circles. They also expand and shrink, indicating the amount of electricity being transported – these are power lines. As the legend to the far bottom right shows (under “Leitungsbelastung” or line load), a black line indicates alternating current, whereas a gray line is direct current.

    Obviously, part of the investigation concerned what power lines would be needed. At various moments, large blue circles appear out in the water north of Germany, where wind farms are to be installed offshore. Likewise, we get a feel for how much is consumed and produced where in the country, though the hourly representation does not tell us what the average is over the year. To find bottlenecks, you would have to go in and check various locations on an hourly basis to see what steps need to be taken – a task probably best performance with the raw data, not this visualization.

    Drop me a comment below if you have any particular questions, and I will be back with a presentation of the background document, including the assumptions. Two things are already clear, however. First, it is useful to collect data in order to make such extrapolations for the future possible. And second, all of this is a purely technical feasibility discussion. It is quite possible that the amount of storage needed in this scenario, for instance, would make this particular arrangement unaffordable.