NEVILLE GILLMORE @ARTHURSLEA 5h
Abengoa says CSP with storage will beat baseload gas by 2020 http://shar.es/V7Ng7 via @renew_economy
NEVILLE GILLMORE @ARTHURSLEA 5h
Abengoa says CSP with storage will beat baseload gas by 2020 http://shar.es/V7Ng7 via @renew_economy
Warming is bad? Watch food supplies after just one frost in summer — J. Everett
“Consequently, we should fear a deep temperature drop….” — H. Abdussamatov (October 2009 translation)
Are there more buildings and roads near your community thermometer since it was installed?
Just found (Dec 09) CIA cooling report: “The western world’s leadlng climatologists have confirmed reports of a detrimental global climatic change [cooling]. The stability of most nations is based upon a dependable source of food, but this stability will not be possible under the new cllmatic era. A forecast by the University of Wisconsin projects that the Earth’s climate is returning to that of the neo·boreal era (1600-1850) – an era of drought, famine, and political unrest in the western world.” (1974)
New: Our Climate Change and Climate GatePositions
Annual US temps 2011(best data): 0.2C above 100+ yr avg. December 2011 above average – No rising trend.sharp 75 year decline of 2F
Antarctic Sea Ice 3% above average (overall trend up)
Arctic Sea Ice rises to 8% below average
Global Sea Ice at 3% below average
2011 Global: +.51C anomaly; 11th warmest since 1890
CO2 rises to 0.000392
Sea Level rising 3.5 mm/yr
Sea Level Trends – Interactive Map
Sun spots continue at low level
VOA: Cold Snap Slugs Europe; Thaw a Threat (Feb 7, 2012)
MSN: Cold wave hits Europe: In pics (Feb 7, 2012)
YAHOO: Europe struggles under record cold snap (Feb 6, 2012)
Accuweather: So Very, Very Cold In Alaska For January with Impressive Records (Feb 1, 2012)
Thousands stranded in Europe by heavy snow:. 16 Bulgarian towns recorded their lowest temperatures since records started 100 years ago. (Feb 2, 2012)
Arrival of the first plants cooled the planet…triggered a series of ice ages (Feb 01, 2012)
With sun’s activity set to diminish, is global cooling coming? (Jan 31, 2012)
WSJ: No Need to Panic About Global Warming (Jan 27, 2012)
Congressional Hearing – 2007
Wildlife & Oceans in a
Changing Climate
My Opening Statement
My Written Statement
My Follow-Up Responses
My Invitation to Testify
Future Climate Change Meetings
Univision Interview (English)
Entrevista Cambio Climático (Spanish)
Our Business Sites
Ocean Associates, Inc. (Oceans & Fisheries Consulting)
OceansArt (Ocean & Other Photos)
TechnologySite.org (Info & Photos)
Study of the orbital mechanics of the solar system in the 1970s led Russians to believe the Earth was about to cool and we should prepare quickly because it will be catastrophic. Their arguments were lost in the rush to warming group-think in the 1990s, but the arguments for impending cold are well founded and still believed by many good scientists. As the sun goes even quieter and January, 2008 saw the greatest year to year temperature drop ever (128 years of NASA GISS data) and thru the end of 2008 remains relatively cool, it is clear cooling needs to be considered as a very plausible future. This is highlighted by 2 papers published in March 2008. Scafetta and West showed that up to 69% of observed warming is from the sun and remind us that the sun is projected to cool and Ramanathan and Carmichael show that soot has 60% of the warming power of CO2. Both papers state that these factors are underappreciated by IPCC. The soot may well explain the Arctic melting, as it has recently for Asian glaciers. Many scientists believe the temperature changes are more dependent on the sun than CO2, similar to the relationship in your home with your furnace. With the Sun’s face nearly quiet, the monthly patterns over the last 12 months are most similar to those of 1797 preceding the Dalton Minimum of 1798-1823 during the little ice age (Timo Niroma).
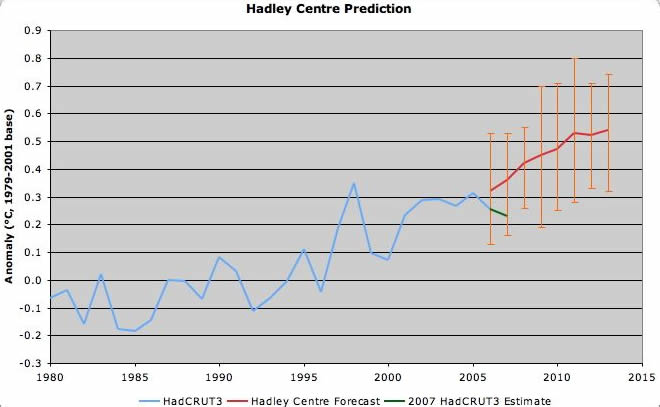
The southern hemisphere has been cooling over the last 10 years, just about as much as the north has been warming. There is no proof within observational data of warming outside of natural variation. When 3 of the highest 5 or 6 years in the temperature record (since 1890) occurred over 70 years ago and 1900 was warmer than recent years in the USA (where the best data are), we are nowhere near statistical proof, nor even evidence of warming. Modelers are still unable to include important variables and no one is able to predict the future. At least Hadley Centre have tried (below). While CO2 continues to rise, the temperature has stabilized at a warm level, but not unusually so. Which way will it go? The world seems to be betting on warming. However, the probability of cooling may be equally valid and we must be prepared for both. Cooling presents the real danger. Things that go up and down only go so high. It has always been this way. Image of current northern sea ice (latest). Check the S. hemisphere sea ice (latest).
Virtually all scientists agree that the Earth has warmed a small amount since the year 1000 or, if you choose, since 1850, when instrumented temperature records became reasonably accurate and distributed in key areas of the world. An alternative view, is that the Earth has been cooling since the 1930s when we had 3 of the 5 warmest years since 1860 in the US, and probably globally if the world environmental data base were cleaned up as is happening in the US. This site will be developed to show the science and the impacts related to global cooling, a very scary event compared to warming. It corresponds in the opposite way to the thousands of global warming sites. An unbiased view is at our sister-site: Climate Change Facts. The Editor started his interest in climate change in the 1970s, charged with helping industry adapt to the certainty of global cooling. Tim Ball has documented the cooling trend and its implications.
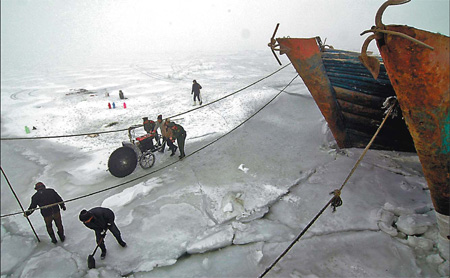
Heavy snow and unusually cold weather have swept across most parts of China this winter, causing travel chaos on roads and on the sea, with forecasters predicting worse to come. Huludao is facing the worst sea ice in three decades and the sea froze a month earlier than usual.
“The sea ice is about 60 nautical miles (110 km) off the coast of Liaodong Bay,” Liu Yu, the station’s chief forecaster reported.
There are still many solid scientists who think that the amount of warming is so small that it is indistinguishable from the noise in the environment data sets, and that the data have not been properly adjusted for such things as urban heat island effects, and instrument calibration. This is particularly true of the global data set, even though “urbanization has caused regional increases in temperature that exceed those measured on a global scale, leading to urban heat islands as much as 12°C hotter than their surroundings“. Also, it is generally accepted that the Earth has been much wa
rmer than today, for example, in the time of the dinosaurs (the mid-cretaceous period) when the CO2 was 2 to 4 times greater than today (NOAA). More recently, in the prior period between ice ages, just 125,000 years ago, the Earth also was much warmer than today and the sea level much higher – by about 13 to 20 feet (4 to 6 meters) (IPCC). The primary driver of the past climate shifts is believed to be orbital mechanics and solar variability, with some contribution from Earth geophysical processes, such as volcanic eruptions. It is also known that mankind’s contribution to CO2 is just a small percent of the total amount. The Earth’s ability to absorb CO2 has apparently been underestimated and the climate models need revision per the 31 December 2009 publication of work by Wolfgang Knorr that shows “No Rise of Atmospheric Carbon Dioxide Fraction in Past 160 Years” (a seminal study). Lastly,, we know that the Earth’s temperature and the level of CO2 rise and fall roughly together, but it is not clear (not proven) whether this is cause and effect by either variable. In a first attempt to use a CO2 – based model to predict temperatures, the results are not impressive at all and are exactly opposite observations.
Despite what the newspapers say, the cause of the temperature rise, and therefore the future course, is settled only within the consensus group of scientists. This is based on work of computer modelers, believing their increasingly complex models show the cause is due to man’s activities and that there will be increasing temperatures according to how much additional greenhouse gases are emitted. TScience News: Chilling Possibilitieshere are many other scientists who are non-modelers, many with backgrounds as atmospheric physicists, climatologists, engineers, meteorologists, and paleo-climatologists, who do not believe the primary cause is mankind, although this could be part of it. Most of these scientists believe that the sun is at the root of the warming (if any), but that other factors are also at work. To help separate fact from fiction, an explanation of these thoughts is included here, along with links to these materials.
The chart below is from the Climatic Research Unit (CRU) at the University of East Anglia, which is well respected for its historical databases maintained at the global level, and which are used in IPCC assessments. See the chart for 1860 to present by month, year and quarter by hemisphere. Note that “global” warming is greatest in the Northern hemisphere. Links to similar charts, Hadley composite charts but all slightly different with different assumptions or algorithms to fill in missing or sparse data, are provided in the left margin below. The Japan Met. Agency (JMA) site is recommended because it is interactive and allows you to query the data base. For example, go to the JMA site and try different months, such as August and September. This will confirm the IPCC models that predict more warming will occur during the winter months than the summer. We don’t know if this true.
This chart looks ominous until put into the context that the average temperature for 1901-2000 is 13.9C (57.0F), so we are talking about a change from about 13.5 to 14.3 C or 56.3 to 57. 7 F. Scientifically, we should use absolute temperatures, which would add an additional 273 C (460 F) degrees. In this context the increase is about 0.3 % Note on the chart that this premier data  set puts the observed global warming at 0.42 deg. C (0.8 deg F) above the mean. As seen below, this increase since the mid 1800s is similar to that since the year 1000, although IPCC says the present temperature is likely higher. Greenland ice cores indicate that the start of the instrumented data (thermometers) coincides with a cold period in the northern hemisphere and that at the site of a well-studied ice core (Global Cooling-Doomsday Called Off), the temperature in the mid 1800s was the coldest in 8,000 years.
For the USA, the trend is less pronounced. Three of the 5 warmest years occurred about 80 years ago and 1900 was warmer than many recent years. NOAA/NCDC revised data on May 1, 2007 and NASA did so in August 2007. Per NOAA: This new data set uses mostly rural data and algorithms are used to identify and correct extraneous factors such as urban heat island effects. NOAA: “U.S. and global an nual temperatures are now approximately 1.0°F warmer than at the start of the 20th century, and the rate of warming has accelerated over the past 30 years, increasing globally since the mid-1970’s at a rate approximately three times faster than the century-scale trend. However, we are still cooler than in the 1930s and several recent years are below 1900. Comment: The use of this new NOAA data set has dropped the temperature increase to 1.0 deg. F (.56 C) from the “improved data set of 2005” which had yielded a rise of 1.12 F. NOAA also says: The global annual temperature for combined land and ocean surfaces in 2006 was +0.54°C (+0.97°F) above average. But in the most recent data NOAA NCDC: “For the contiguous United States, the average temperature for October was 54.5°F (12.5°C), which was 0.3°F (0.2°C) below the 20th century mean, and ranked as the 44th coolest October on record, based on preliminary data.” The NASA GISS chart of US data is shown. Our view:
 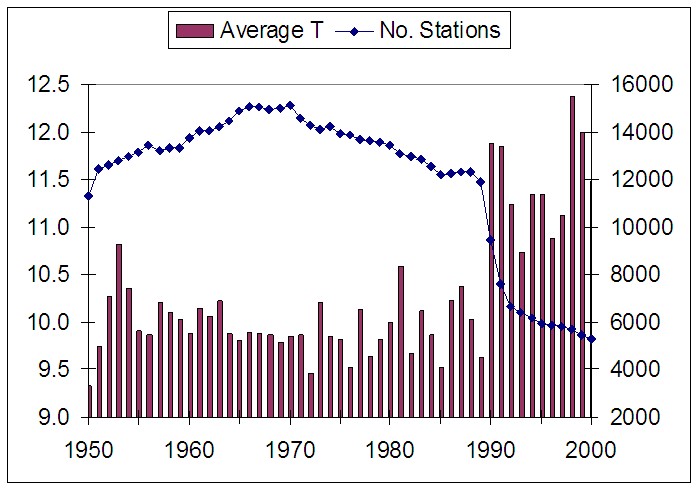 It is not clear this is worth getting excited about, given that the benefits of warming likely exceed the detriments and that this rise may be a data artifact, or a mostly natural variation. We believe if the global data set were given equal scrutiny to the US set, global warming would either vanish or be barely detectable. Russian Academicians believe major cooling is imminent. The January 2009 PRAVDA ice-age article is likely vetted by them and the IPCC co-chair.
As the number of stations (often rural) has fallen the temperature has risen in an inverse relationship, suggesting the Urban Heat Island effect is the key component of any rise.
In the prior inter-glacial period about 125,000 years ago, there was no summer ice at the North Pole and the sea level was 15 feet (5m) higher than today. Is this going to happen anyway? Is our temperature just naturally rising and if our own CO2 is helping it along, won’t temperature still rise, even when we stop breathing?
IPCC 2007 reports the prior inter-glacial warmth was driven by orbital mechanics that are not present today. Nevertheless, this prior warmth tells us much about what the true impacts will likely be because nearly all the plant and animal species on Earth now were present then also.
Resource alarmists believe we will soon run out of fossil fuels. As soon as this happens, it seems, prices will rise and the CO2 problem will simply go away as plants clear out the CO2, that seems to be getting ahead of their ability to remove it. For reason to prevail, as depicted in the GCMs (Global Circulation (or Climate) Models), somebody must know of magnificent petroleum reserves hidden from the prophets of doom. Different parts of certain NGOs (Non Governmental Organizations) ought to get together to get their story straight. If we were to take the IPCC approach, we would look at the literature and note the range of projections and include all these impacts. Doing so would show that the US Energy Information Agency seems alone in showing a growth in oil and gas production for 20 years (limit of projection), driven by increased prices as demand outstrips supply. This is not unreasonable. Other energy advisors in the private sector see a 25% drop in production in about the same period. The projection to the end of the century ranges from sharp reductions to zero output of oil and gas. The reserves of coal are much greater and production will peak later, but soon, within 10 years being often proposed. For most coal producing countries, coal output is in steady decline. Shortages will drive prices making recovery of presently marginal sources and types of fossil fuels feasible. But, it is all a matter of time before CO2 production from all fossil sources declines. The upheaval to society will likely surpass even the most extreme visions of global warming impacts. In March 2008, the price of coal had risen 50% over sixmonths, and the upheavel was documented by the Washington Post. The Earth’s ability to absorb CO2 has apparently been underestimated and the climate models need revision per the 31 December 2009 validation of work by Wolfgang Knorr that shows “No Rise of Atmospheric Carbon Dioxide Fraction in Past 160 Years”.
My specialty is in impacts assessment (oceans, coasts, fisheries, polar regions), not the science of climate change. However, to determine impacts correctly, one must understand the nature of change and its likelihood to continue. It is necessary to have trust in what the climate scientists tell you is going to happen in the future. In the IPCC structure, the science has been led by the UK and US scientists, and they have used modeling as their primary tool, with some paleoclimate analysis coming later. The Impact Assessments have been led by the Russians, who have had an intense distrust of modeling. They viewed paleoclimatology as the most valid tool: if you want to know what will happen when CO2 rises or the temperature changes, they say to look at the history of the earth. As an American, working with the Russian teams, I was often caught in the middle of both camps. I learned to listen to both views, and continue to do so. In particular, we learned to distrust any science literature or impacts assessment that did not consider all data available, whether modeling, the instrumented record back into the 1800s and/or the paleo and historical temperature reconstructions. If the data are truncated, there is likely an agenda. Many of us have learned, either formally, or informally, how to detect misrepresentation by statistical treatments and graphics.
When reviewing impact assessments, look for bias. Often the authors think only of negative changes. This is not necessarily because of personal agendas (such as to assist animals, clean the air, or reduce the birth rate), but is primarily due to human nature. To guard against having a biased report, one should look for balance. Does the material articulate that things will be different and that there are pluses and minuses? There may well be more of one than another. Sometimes balance is reflected in the amount of text, or graphics made to illustrate impacts and often it is reflected in the number of negative versus positive impacts, the latter often left out completely at the first draft stage. If missing, they tend to be only partially treated thereafter as the authors slowly yield to reviewer comments. Examples of balance:
Oceans and coastal zones, the things I know best, have been far warmer and colder than is projected in the present scenarios of climate change. Marine life has been in the oceans nearly since when they were formed. During the millennia they endured and responded to CO2 levels well beyond anything projected. Prior temperature changes put tropical plants and coral reefs near the poles or had much of our land covered by ice more than a mile thick. The memory of these events is built into the genetic plasticity of the species on this planet. IPCC forecasts are for warming to occur faster than evolution is considered to occur, so impacts will be determined by this plasticity and the resiliency of affected organisms to find suitable habitats. Species mixes and distributions will change, just as they always have. Some species will be so disadvantaged they will go extinct and ecological niches will develop that offer opportunities for new species to arise.
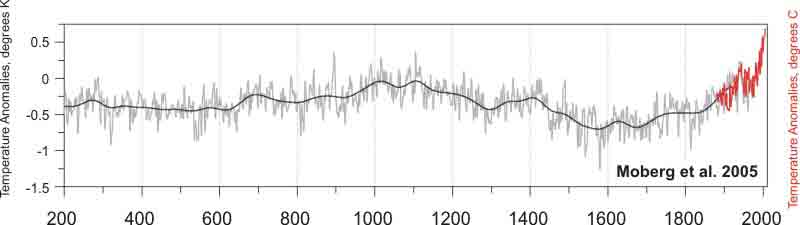
The chart is of the Paleo Record. Northern Hemisphere Annual Temperatures from Low- and High-Resolution Proxy Data over the last 2000 Years. The red signifies only the use of the instrumented record, since about 1860.(From NOAA/NCDC).
In the oceans, major climate warming and cooling is a fact of life, whether it is over a few years as in an El Niño or over decades as in the Pacific Decadal Oscillation or the North Atlantic Oscillation. Currents, temperatures, salinity, and biology change rapidly to the new state in months or a couple years. These changes far exceed the changes expected with global warming and occur much faster. The one degree F. rise since about 1860, indeed since the year 1000, has brought the global average temperature from 56.6 to 57.4 degrees F (13.5 to 14.3 C). This is at the level of noise in this rapidly changing system. Sea level has been inexorably rising since the last glaciation lost its grip, and temperatures rose by 10-20 degrees, a mere 10,000 years ago. It is only some few thousand years since Georges Bank was part of the mainland. It is now 60 miles offshore of Provincetown on Cape Cod. Its trees and the shells of its oysters that flourished on its shores still come up in dredges and trawls in now deep water, with the oysters looking like they were shucked yesterday. In the face of all these natural changes, and those we are here to consider, some species flourish while others diminish. These considerations were well 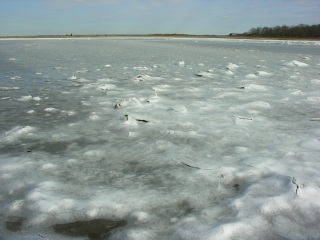 understood in all the IPCC groups in which I participated. I have some concerns about some few species near the margins of their suitable habitat range. These include corals near the equator and perhaps polar bears. But I would much rather have the present warm climate, and even with the IPCC’s warming, than the next ice age that will likely last over 100,000 years and bring temperatures much colder than even today. The NOAA PaleoClimate Program shows us that when the dinosaurs roamed the earth, the earth was much warmer, the CO2 levels were 2 to 4 times higher, and coral reefs were much more expansive. The earth was so productive then that we are still using the oil, coal, and gas it generated. In contrast, the last ice age maximum, at just 20,000 years ago saw temperatures 4-7 deg. C (7.6-13.6 F) cooler than present. The one deg. F rise since the 1850s is a relatively small component. (Photo of frozen North Cove, Fairhaven Mass. in March 2007; courtesy of OceansArt.us).
IPCC: Global average sea level in the last interglacial (Eemian) period (130,000-111,000 years ago) was likely 13 to 20 feet (4 to 6 meters) higher than during the 20th century, mainly due to the retreat of polar ice. Ice core data indicate that average Arctic temperatures at that time were 5.7 to 9.5 deg. F (3 to 5 deg. C) higher than present, because of differences in the Earth’s orbit. The Greenland ice sheet and other Arctic ice fields likely contributed no more than 13 feet (4 meters) of the observed sea level rise. There may also 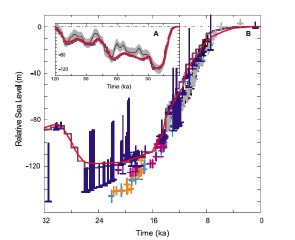 have been a contribution from Antarctica. Note in the chart how the rate of sea level rise is very low compared to that when the ice age wanes. (Chart/text IPCC 2007).
NOAA: The Mid-Cretaceous period is one period in the geologic past that stands out as distinctly warmer than today, particularly at high latitudes. During the mid-Cretaceous Period, 120-90 million years ago, fossil remains of plants and animals believed to inhabit warm environments, were found at much higher latitudes. Breadfruit trees apparently grew as far north as Greenland (55° N), and in the oceans, warm water corals grew farther away from the equator in both hemispheres……. The mid-Cretaceous was characterized by geography and an ocean circulation that was vastly different from today; as well as higher carbon dioxide levels (at least 2 to 4 times higher than today). This indicates that the mid-Cretaceous climate system was different from that of today or any we might have in the future. Explanations evoking ocean and atmospheric circulation patterns radically different from today have been proposed to explain the climate of the mid-Cretaceous; however, there is no scientific consensus on how the Mid-Cretaceous warm climate came about (source: NOAA Paleo Climatology program). In some ancient times when CO2 levels were very high, ocean organisms with shells based on silica replaced those with shells based on calcium.
During the Mid-Pliocene (about 3 million years ago) global temperatures were substantially warmer for a sustained period and are similar to those forecast by IPCC, with similar CO2 and sea levels of 15-25 meters (50-82 ft.) greater than today. Most of the warming was in the high northern latitudes with little warming in the tropics. Even just 7 thousand years ago, in the midst of the present period (Holocene) between glaciation, the Russian Arctic, at least, was 2.5-7 deg.C (4-12 F) warmer than today (Quartenary Research).
Dr. Nils-Axel Mörner (leading expert on sea level): “If you go around the globe, you find no rise anywhere. But they need the rise, because if there is no rise, there is no death threat. They say there is nothing good to come from a sea-level rise, only problems, coastal problems. If you have a temperature rise, if it’s a problem in one area, it’s beneficial in another area. But sea level is the real “bad guy,” and therefore they have talked very much about it. But the real thing is, that it doesn’t exist in observational data, only in computer modeling.” Dr. Mörner’s credentials. In a 2009 study, using GPS measurements to correct for local vertical movement of the Earth at key tide gages, finding a “global rate of geocentric sea level rise of 1.61 ± 0.19mm/yr over the past century“. Their study shows no acceleration and no changes in rate during warm or cold periods of the last 110 years. It is virtually a straight-line rate of increase, independent of Earth’s temperature.
We should respond prudently to the threats from climate change. These actions should include things that make sense in their own right and which will be important whether the Earth warms or cools in the near future. In the distant future it is a certainty that the Earth will warm beyond what we have today and that the next ice age is waiting in the wings, but not for another 30,000 years or so, according to our present knowledge of solar variability and orbital mechanics (IPCC 2007). If we are concerned about global warming, a guiding principle is to do things that yield a cost savings or are neutral. Overall, we should aim to reduce our cost of goods sold and, at the consumer level, our living expenses, while at the same time “cleaning up our act”. What should we do now? See Ways to Improve Energy Efficiency and Energy Sources. We also have a mixture of half serious and tongue-in-cheek ideas to halt climate change.) All of us should lead by example, and as much as possible, within the market place, while keeping our personal freedoms we hold so dear. One way to check? Look at your household energy consumption. It is reasonable to have it drop one percent every two years for as long as you have been in your house, just from household maintenance, appliance replacement and replacing light bulbs with fluorescents or LEDs when they burn out. All lights on timers, for example, should be fluorescents (See cflsafety.blogspot.com for a review of safety concerns). Do we adjust the thermostat for when nobody is home? Is our shower just a little too long? Perhaps the biggest example would be in not begetting more children than is socially responsible. See our list of ways to secure energy sources, improve efficiency and alternative energies.
We must respond prudently to the threats from climate change. We live in a global economy, much of it with lower production costs than our own in the developed world. Whether we live in the USA, Japan, Australia, New Zealand or the EU, we know our job losses are draining our countries, making it more difficult to support our retirement programs, health benefits, and even our national defense. We must be careful to not further increase the costs of our products and services. So we —
There are four elements separating consensus and skeptic scientists. Not all elements are disputed by everyone. The elements are: (1) the amount of temperature change since 1850; (2) whether the change is in the range of natural variability or is attributable to humans; (3) the amount of warming that greenhouse gases (CO2 and equivalents) will warm the Earth in the future; and whether for the most likely scenarios, there are more losers than winners and if the change is just different. Underlying these elements are several issues:
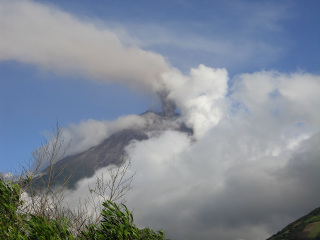
These issues and many more are hotly debated on consensus and skeptic websites and blogs. Some representative Consensus and Skeptic sites with at least a reasonable amount of scientific basis are linked on the left navigation column. One constant debate is the importance of undersea and terrestrial volcanoes in contributing CO2 and the cooling effect of the ash cast into the sky. The photo shows Mount Tungurahua active in July 2007. Click on Mount Tungurahua for larger version and text (Source: www.OceansArt.us).
“Participants discussed whether it would be clearer to state that warming of the climate system is “unequivocal” or “evident.” Participants agreed to state that warming is “unequivocal.” Canada, with Germany and Switzerland, suggested adding a reference to the accelerating trend of warming. China, New Zealand, and South Africa, supported by the Coordinating Lead Authors, opposed this, given the possibility of decadal variability, and the reference was not included in this section.
On text noting high decadal variability in Arctic temperatures, Canada, supported by Norway, suggested removing a specific reference to a warm period observed from 1925 to 1945. The Coordinating Lead Authors explained that “climate skeptics” often point to this warm spell to question the IPCC for not acknowledging such warm spells. Participants agreed to keep the reference.”
An excellent review of the issues and how the “consensus” has made a mistake is presented in an excellent article (written by Bob Foster) of sufficient quality to be included among the British briefing documents on Her Majesty’s Treasury website.

“Science” (27 September 2007) reports that the loss of Antarctic ice triggered the last warming and eventual emergence from the last ice age. Will the current expansion of Antarctic ice coverage be sufficient to trigger the next ice age? The Arctic reached record low ice coverage in 2007, but Antarctic ice coverage at the same time was at or above the highest levels ever recorded. In each case, reliable measurements date only from the arrival of satellite data in the 1970s, another usually omitted fact. Since the Northwest Passage was navigated by sailing vessels in 1903-1905 (Gjøa/Roald Amundsen) , and again in 1940-42 and 1944 (St. Roch), this recent reduction in Arctic ice may not be an indicator of warming. Antarctic Temperature Chart from CO2Science.org. The up-to-date Southern Hemisphere Sea Ice Anomaly chart is based on the era of satellite data, beginning in 1975. The current anomaly for the last 365 days is also available.
IPCC invites Authors for next assessment (Jan 2010)
China Daily: Sea ice causes fishery loss (Jan 2010)
Cold grips Europe. Deaths rise (Jan 2010)
Climate Houston: Earliest snow ever (Dec 2009)
ClimateGate hurts IPCC credibility (Nov 2009)
Scientist: Cooling is real (Oct 09)
NASA: Sunspots disappearing (Sep 2009)
NOAA: Summer US Temps fall to average (Jul 2009)
BBC: Child-killing cold in Peru due to climate change (Jul 2009)
Scientists: Cooling is a mystery (Mar 2009)
Modeler: (Despite cooling) Warming will be worse than predicted due to higher emissions (Feb 2009)
Snow Paralyzes London (Feb 2009)
Science: Greenland Ice Argammedon Stops (Jan 2009)
Russians: Ice Age Imminent. Story likely vetted with Academy of Science (Jan 2009)
US temps (best data) fall below 100+ year average (Dec 2008)
Global Sea Ice ends 2008 near 30 year average (Dec 2008)
Antarctic ice ends 2008 above mean (trend up), while Arctic remains near mean then rises again. (Dec 2008)
Asian soot damaging glaciers (Nov 2008)
Arctic ice refuses to melt as ordered: 30% Above 2007 (Aug 2008)
Big Chill in Queensland (Jun 2009)
Record Cold in Anchorage (Jul 2008)
ScienceDaily: Sunspots missing. Could signal start of cooling as in 1600s. (Jun 2008)
Nature: Antarctic deep water cools (Apr 2008)
Will Global Warming Take a Short Break? (Jun 2008)
Soot: 60% of CO2 warming; ice loss (Mar 2008)
Sun, 69% of warming, is set to cool (Mar 2008)
Chill deepens across world (Mar 2008)
Antarctic Ice at new high (Feb 2008)
Coldest winter in decades (Feb 2008)
Sun goes quiet. Cooling is closer (Feb 2008)
NASA data: Janusary temp drop greatest Yr-Yr since 1880 (Jan 2008)
China has worst winter in 5 decades (Jan 2008)
Ice accumulation rate doubled since 1850 in W. Antarctica Peninsula (Jan 2008)
Russia Warns of Cold Emergency in Siberia: -55C (-67F) (Jan 2008)
Global Sea Ice back above normal (Jan 2008)
Snow shuts hundreds of schools in New England, after snowiest Dec.
Snow falls in Baghdad for first time in memory (Jan 2008)
We have only a few years to prepare before lasting and dangerous cold arrives (Jan 2008)
Russian Academician: Cold replacing warmth for decades to come (Jan 2008)
Florida Braces for Freeze: Temps into the teens and 20s (F)
400 Prominent Scientists Dispute Global Warming: US Senate Report
Snow sets New Hampshire record. The old record was set in 1876 and Chicago snowfall at double the 30 year average.
Polar Bears survived warmer periods. Polar bear jawbone found.
Pope assails climate alarmists. People come first; science must be sound.
Decrease of solar activity is harbinger of 1.5 deg C drop by 2020 (3X the rise of the last Century)
Argentina November frost devastates agriculture. 10% of wheat lost (Español).
Half of all warming since 1900 is due to sun say Duke University and US Army researchers (Nov 2007). The rest poor global data.
UN Sec General challenges states on warming. Says real and affordable options exist.
Arctic Ocean Reverses. NASA: not all the changes in Arctic climate are from global warming (Nov 2007)
As much as 120 centimeters of snow had fallen on the Alps as of mid November, the largest amount at the start of winter in more than 5 decades (Nov 2007)
Buenos Aires records its lowest temperature for November in 90 years, 2.5 deg.C. (Nov 2007(Español)).
The Northern Hemisphere continues to restore its lost ice at a rapid pace. As of the end of November, the anomaly is at just 1 million sq. km., 1/3 of October’s. (Nov 2007)
With rapid re-freezing of the Arctic Basin in October, the ice loss anomaly has been cut in half as of 1 Nov. 2007.
The Antarctic ice sheet continues at a high level, but not enough to raise the total ice coverage trend at the global level. It is still at about the lowest point since monitoring began in 1979. (Nov 2007)
The wind caused the Arctic ice loss. NASA scientist Son Nghiem says “The winds causing this trend in ice reduction were set up by an unusual pattern of atmospheric pressure that began at the beginning of this century,” (Oct 2007)
There is no threat to our ability to breathe. Oxygen and nitrogen still make up 99% of our atmosphere. Methane, CO2 and the other greenhouse gasses make up a minuscule part of what we breathe, but they have important abilities to make the Earth warmer. The gases in the atmosphere (in order) by percent are:
|
Why this ad?
3kW Opal Solar System – evolvedelectrical.com.au – 12x 250w Opal Solar Panels, 3kW Zeversolar Inverter, Fr $2999
|
|
Inbox
|
x |
|
11:54 AM (46 minutes ago)
|
|||
|
||||
|
|
||||||||||||||||||||
|
| UN Security Council Resolution 1747 |
|
|---|---|

|
|
| Date | 24 March 2007 |
| Meeting no. | 5,647 |
| Code | S/RES/1747 |
| Subject | Non-proliferation |
|
Voting summary
|
15 voted for None voted against None abstained |
| Result | Adopted |
| Security Council composition | |
|
Permanent members
|
|
|
Non-permanent members
|
|
|
|
|
|
|

Flag of the United Nations

Flag of Islamic Republic of Iran
United Nations Security Council Resolution 1747 was a United Nations Security Council resolution that tightened the sanctions imposed on Iran in connection with the Iranian nuclear program. It was adopted unanimously by the United Nations Security Council on 24 March 2007.
In June 2006, the five permanent Security Council members plus Germany offered a package of economic incentives including transfer of technology in the civilian nuclear field, in exchange for Iran to give up permanently its disputed uranium enrichment programme.[1]
Iran did not accept this offer because it was not attractive enough and because of its inalienable right to enrich uranium for peaceful purposes, it says. To justify its position, Iran made reference to previous accords concluded between the late Shah of Iran and the West regarding Eurodif and Bushehr. Iran has also referred to similar accords between the West and other countries like North Korea or Libya, where agreements reached and promises made have not been kept. In Resolution 1737, adopted by the Security Council in December 2006, an initial series of sanctions against Iran was implemented because it did not suspend its uranium enrichment programme.
In the Resolution 1747, the Council decided to tighten the sanctions imposed on Iran in connection with that nation’s nuclear program. It also resolved to impose a ban on arms sales and to step up the freeze on assets already in place. The successive Security Council interventions and positions are summarized hereafter:
Access to nuclear sites: According to the International Atomic Energy Agency (IAEA), Iran has not yet declared the full scope of its programme and has not allowed a full-unrestricted access to all its nuclear sites. The programme is 18 years old, and part of it was outside of the IAEA preview. This situation has worried the IAEA and the international community. Iran says that it has allowed the IAEA to access all its nuclear sites, voluntarily and more than any other country by signing additional NPT protocols.
Iran’s previous suspension: Iran has said that a previous agreement to suspend uranium enrichment for two years in 2004 did not yield any tangible results for any party. Iran has expressed an official concern to disclose more information to the IAEA because of the repeated military threats made by the West since 2005.[2] Subsequently, the IAEA has declared it is unable to conclude there are no undeclared nuclear materials or activities in Iran and has referred the file to the Security Council.[3]
United Nations position: The permanent Security Council members, including Russia and China, have declared their intentions to prevent Iran from acquiring weapons of mass destruction because of its belligerent rhetoric towards the West and Israel since the Iranian Revolution.[4] In principle, the UN Security Council (UNSC) and the International Atomic Energy Agency (IAEA) have confirmed Iran’s right to peaceful nuclear technology in conformity with the Nuclear Non-Proliferation Treaty (NPT).[5]
Iranian stance: Iran said it wanted to build a network of nuclear power plants with a capacity for 20,000 MW by 2020.[6] Iran has referred to its inalienable right to develop nuclear technology for civilian and peaceful purposes under the NPT to justify its position.[7] The Supreme Leader of Iran has stated in a fatwa that possession and use of nuclear weapons is “anti-Islamic“.[8] Iranian officials have insisted that they have no intention to develop nuclear weapons. This point has been strongly questioned by the West because uranium enrichment is a dual-use technology.
Iran has dismissed the sanctions and said it did not intend to suspend its enrichment programme. Iranian Foreign Minister Manouchehr Mottaki told the Security Council after the vote: “The world must know – and it does – that even the harshest political and economic sanctions or other threats are far too weak to coerce the Iranian nation to retreat from their legal and legitimate demands.” He added: “Suspension is neither an option nor a solution”.[9]
Non-Aligned Movement’s position: Iran has reminded the Security Council of the Non-Aligned Movement‘s support for its civilian nuclear programme and its opposition to any military attack against Iran. This declaration by the Non-Aligned Movement, at the summit level, represents 118 countries.[10]
Iran and weapons of mass destruction: As of 2007, Iran is not known to possess weapons of mass destruction and has signed treaties repudiating their possessions, including the Biological Weapons Convention, the Chemical Weapons Convention, and the Nuclear Non-Proliferation Treaty (NPT). A number of countries, including the U.S., United Kingdom, and France, have accused Iran of a clandestine intention to develop nuclear weapons.[11] By most estimates, Iran is at least two to six years away from being able to produce an atomic bomb, even if it wanted to.[12]
Western hypocrisy: Iran has said it does not accept to be lectured and pressured by the West and it has accused the West of “hypocrisy and double standard”. Iran has condemned the Security Council members for not doing what they preach to others: namely, getting rid of their own weapons of mass destruction, as it is their duty under the NPT.[13][14] In March 2006, Iran strongly deplored United Kingdom‘s decision to renew its Trident missile nuclear weapons system. It also feels threatened by the United States military deployment in Iraq, Afghanistan and in the Middle East. Iran has pointed to the fact that the United States is the only country who has ever used nuclear weapons in history and has not ruled out the possibility to use them again in the future as part of the Bush doctrine, and against the UN Charter.
Double standard: Iran has said that the double standard applied to Israel is unjust and disturbing given its possession of nuclear weapons, its non-adherence to the NPT, and its treatment of the Palestinians over many years. Israel has unofficially stated it needs to have nuclear weapons to assure its survival in a predominantly hostile Middle East environment, since its independence in 1948 and following the Holocaust. Iran has responded that Arabs and the Middle East should not bear responsibility for crimes against humanity and atrocities committed by the Nazis during World War II against the Jews in Europe.[15]
Nuclear fuel: In 1995, Russia signed a contract to supply a light water reactor for the plant (the contract is believed to be valued between $700,000,000 and $1,200,000,000 USD).[16] Although the agreement calls for the spent fuel rods to be sent back to Russia for reprocessing, the US has expressed concern that Iran would reprocess the rods itself, in order to obtain plutonium for atomic bombs. In March 2007, following Iran’s refusal to halt enrichment, Russia announced it will withhold the delivery of nuclear fuel, pretexting overdue payments vis-à-vis the Bushehr reactor even though Iran has denied any late payment. Consequently, Bushehr should be commissioned by early 2009, after five delays of two years each.[17]
Air defense system: Russia has declared repeatedly its opposition to any military attack against Iran’s civilian nuclear facilities. In January 2007, Russia announced the sale of 29 units of its Tor Missile System to Iran as part of a one billion dollar deal to protect its installations.[18]
Economic reasons: Iran has stated that its programme is motivated by economic needs and scientific progress only. Iran has said its large petroleum reserves will inevitably extinguish, given its increasing domestic energy consumption and because of its oil exports. Iran has referred to U.S. government reports from the time of the Shah and independent U.S. estimates as recent as 2006 to justify its position.[19] Iran has also referred to Russia’s recent decision to withhold fuel delivery for its nuclear power plant as an additional reason why it cannot rely on other countries for its nuclear fuel needs.[20]
Financial investment: Iran has said it has spent too much money – over ten billion U.S. dollars in the past 30 years – on its civilian nuclear programme to give it up now.[16][21] Furthermore, it has argued that suspension is a way for the West to undermine Iran’s independence and progress. If its rights are not respected by the Security Council, Iran has threatened to withdraw from the Non-Proliferation Treaty. Iran has justified its uranium enrichment programme because it has plans to construct more nuclear power plants in the future.[22]
National pride and independence: In March 2007, it was announced that Iran would issue a 50,000 rial banknote with the subject being the Iranian nuclear energy programme, which has become an object of national pride and the symbol of independence for many Iranians.[23]
Iranian concerns: Other subjects interfere with Iran’s international file at the Security Council, including:
Propaganda: Both parties have resorted to propaganda, psychological war, ideology and defamation through the media to galvanize their troops and win the public opinion.[25][26] Iran has labeled the United States the “Great Satan” and chants “Death to America.” Meanwhile, U.S. President George W. Bush declared Iran part of the “axis of evil.” Iran and the United States accuse each other of not working for the benefit of their own people but for a small group holding to power, even if both parties claim a broad democratic support for their endeavor. A BBC poll conducted in June 2006 found that the world public opinion considered the United States, along with Iran, to be the greatest threats to world peace.[27]
Proxy wars: The United States has accused Iran of undermining peace in the Middle East by supporting economically and militarily warring parties beyond its borders, especially:
Iran accuses the United States to be an “occupier” in Iraq. Nevertheless, Iran has denied any military involvement in Iraq, even though American forces have said they have proof of it. On 25 December 2006, US armed forces arrested and later released four senior Iranian military officials in Baghdad. On January 2007, US controlled forces kidnapped and allegedly tortured five Iranians in Irbil, Iraq, which have not been released yet. In April 2007, those same prisoners were allowed visits by ICRC delegates for the first time.[29] Iran has accused the United States of supporting armed opposition groups against its Government inside and outside of Iran, and conducting UAV reconnaissance flights over Iran since 2005.[30]
Iranian Oil Bourse: According to some experts, Iran is seeking to weaken U.S. global influence by creating an Iranian oil bourse that will trade in Iranian rial and major currencies instead of United States dollars, as well as a gas cartel with Russia, which both have the greatest proven gas reserves in the world. Iran has denied this and has justified both projects based on their sole economic merits.
Iranian threats: Iran has denied it wants to see “Israel wiped off the map” as reported by the foreign media. Iran’s foreign minister has affirmed that Iran’s stated policy on Israel is to urge a one-state solution through a countrywide referendum in which a government would be elected that all Palestinians and all Israelis would jointly vote for. This would normally be an end to the “Zionist state”, similarly to the end of the Soviet Union.[31][32][33][34]
Israeli threats: Iran has referred to Israel’s Defense Forces surprise attack in 1981 against the Osirak nuclear reactor in Iraq and its recent threats against Tehran as additional reasons why it cannot disclose more information about its programme to the IAEA. Israel has stated that “a nuclear armed Iran is not acceptable for Israel” and that it will take military action if the international community fails to curb Iran’s nuclear programme.[35][36] If attacked, Iran has vowed its readiness to retaliate in asymmetric warfare and by using its vast arsenal of missile forces to reach Tel Aviv.[37]
Comprehensive negotiations: Iran has agreed to hold further talks, without the precondition to halt its uranium enrichment programme. The United States has opposed this, even though it has agreed to hold direct talks relating to other subjects like the war in Iraq.[38] In 2003, Iran was known to have made a similar confidential proposal to the United States through the Swiss Embassy in Tehran. Switzerland is the US protecting power in Iran since the Iranian Revolution in 1979. The United States is said to have rejected those discussions, at that time.[39]
International consortium: Iran is ready to consider the creation of an international consortium for uranium enrichment based in Iran as a solution to the current standoff at the Security Council.[40] In April 2007, Iran declared it had reached the early stage in industrial nuclear fuel production following the installation of more than a thousand centrifuges at the Natanz underground facility. Iran has declared it was planning to install 50,000 more centrifuges in the future.[41] In 2005, Iran inaugurated a uranium conversion facility in Isfahan, and a heavy water production plant in Arak in 2006. All declared Iranian installations are under the strict supervision of the IAEA.
|
Why this ad?
EnergyAustralia – energyaustralia.com.au/electricity – Great Energy Deals Online. Switch Online. Get a Quote in 30sec
|
|
Inbox
|
x |
|
7:34 PM (0 minutes ago)
|
|||
|
||||
climate code red |
The real budgetary emergency and the myth of “burnable carbon”
Posted: 22 May 2014 01:46 AM PDT
by David Spratt
How fast and how profoundly we act to stop climate change caused by human actions, and work to return to a safe climate, is perhaps the greatest challenge our species has ever faced, but are we facing up to what really needs to be done?
We have to come to terms with two key facts: practically speaking, there is no longer a “carbon budget” for burning fossil fuels while still achieving a two-degree Celsius (2°C) future; and the 2°C cap is now known to be dangerously too high.
No Carbon Budget Left – David Spratt from Breakthrough on Vimeo.
For the last two decades, climate policy-making has focused on 2°C of global warming impacts as being manageable, and a target achievable by binding international treaties and incremental, non-disruptive, adjustments to economic incentives and regulations (1).
But former UK government advisor Professor Sir Robert Watson says the idea of a 2°C target “is largely out of the window”, International Energy Agency chief economist Fatih Birol calls it “a nice Utopia”, and international negotiations chief Christiana Figueres says we need “a miracle”. This is because, in their opinions, emissions will not be reduced sufficiently to keep to the necessary “carbon budget” (2).
The carbon budget has come to public prominence in recent years, including in the Intergovernmental Panel on Climate Change (IPCC) Fifth Assessment Report in 2013, as being the difference between the total allowable greenhouse gas emissions for 2°C of warming, and the amount already emitted or spent. The budget varies according to the likelihood of overshooting the target: the higher the risk, the bigger the budget. In the IPCC report, no carbon budget is given for less than a one-in-three chance of failure.
At that one-in-three risk of failure, the IPCC says the total budget is 790 GtC (gigatons, or one billion tons, of carbon), less emissions to 2011 of 515 GtC, leaving a budget of 275 GtC in 2011, or ~245 GtC in 2014 (3)
What is less well understood is that if the risk is low, there is no carbon budget left (4).
 |
| Breakthrough National Climate Restoration Forum 21-22 June, Melbourne |
Climate change with its non-linear events, tipping points and irreversible events – such as mass extinctions, destruction of ecosystems, the loss of large ice sheets and the triggering of large-scale releases of greenhouse gases from carbon stores such as permafrost and methane clathrates – contains many possibilities for catastrophic failure.
Ian Dunlop, a former senior risk manager and oil and coal industry executive, says the management of catastrophic risk has to be very different from current processes. As serious, irreversible outcomes are likely, this demands very low probabilities of failure: management of catastrophic risk “must centre around contingency planning for high-impact and what were regarded as low-probability events, which unfortunately are now becoming more probable… Major, high-risk industrial operations, such as offshore oil exploration, provide a model, with detailed contingency planning and sequential barriers being put in place to prevent worst-case outcomes” (5).
If a risk-averse (pro-safety) approach is applied – say, of less than 10% probability of exceeding the 2°C target – to carbon budgeting, there is simply no budget available, because it has already been used up. A study from The Centre for Australian Weather and Climate Research shows that “the combination of a 2°C warming target with high probability of success is now unreachable” using the current suite of policy measures, because the budget has expired (6).
This is illustrated in Figure 1 where, as we move to the right (greater probability of meeting target) along the blue line which is the 2°C carbon budget, we reach a point around 90% probability (blue circle) where the total budget intersects with what we have already emitted.
 |
| Figure 1: Effect or risk on carbon budget, based on based on Raupach, M. R., I.N. Harman and J.G. Canadell (2011), explanatory labels added |
As well, on-going greenhouse emissions associated with food production and deforestation are often conveniently pushed to one side in discussing carbon budgets. UK scientists have shown that if some reasonably optimistic assumptions are made about deforestation and food-related emissions for the rest of the century, then most emission reduction scenarios are incompatible with holding warming to +2ºC, even with a high 50% probability of exceeding the target. In other words, food and deforestation has taken up the remaining budget, leaving no space for fossil fuel emissions (7).
In addition, the carbon budget analysis makes optimistic and risky assumptions about the stability of Arctic, and of polar and other carbon stores such as permafrost. As one example, the modelling discussed in the IPCC report projects an area of summer Arctic sea-ice cover in the year 2100 higher that actually exists at the moment, yet there is a great deal more warming and sea-ice loss to come this century! In fact, many Arctic specialists think the Arctic will be sea-ice free in summer within the next decade, with consequences for global warming that the carbon budget calculations have significantly underestimated. (8)
 |
| View/ download as PDF |
Australian Climate Council member Prof. Will Steffen says the IPCC carbon budget may “be rather generous”. The IPCC report says the modelling used does not include explicit representation of permafrost soil carbon decomposition in response to future warming, and does not consider slow feedbacks associated associated with vegetation changes and ice sheets. Recent research suggests these events could happen well below 2°C of warming, so they should be taken into account, but they are not.
Accounting for the possible release of methane from melting permafrost and ocean sediment implies a substantially lower budget (9). This reinforces the need to take a pro-safety, risk-averse approach to the carbon budget, especially since some research suggests that Arctic permafrost may be vulnerable at less than 2°C or warming (10).
For all these reasons – that is, prudent catastrophic risk management, accounting for food production and deforestation emissions, and for Arctic sea ice and carbon store instability – the idea of “burnable carbon” – that is, how much more coal, gas and oil we can burn and still keep under 2°C – is a dangerous illusion, based on unrealistic, high-risk, assumptions.
A second consideration is that 2°C of warming is not a safe target. Instead, it’s the boundary between dangerous and very dangerous (11), and 1°C higher than experienced during the whole period of human civilisation (12), illustrated in Figure 2. The last time greenhouse gas levels were as high as they are today, modern humans did not exist (13), so we are conducting an experiment for which we have no direct observable evidence from our own history, and for which we do not know the full result.
 |
| Figure 2: Past and future global temperature and the safe-climate zone |
However, we do understand that many major ecosystems will be lost, a 2°C sea-level rise will eventually be measured in the tens of metres (14), and much of human civilisation and large, productive river delta systems will be swamped. There is now evidence to suggest that the current conditions affecting the West Antarctic ice sheet are sufficient to drive between 1.2 and 4 metres of sea rise (15), and evidence that Greenland will contribute more quickly (16), and they are just two contributors to rising sea levels.
It is now clear that the incremental-adjustment 2°C strategy has run out of time, if for no other reason than the “budget” for burning more fossil fuels is now zero, yet the global economy is still deeply committed to their continuing widespread use.
We all wish the incremental-adjustment 2°C strategy had worked, but it hasn’t. It has now expired as a practical plan.
We now have a choice to make: accept much higher levels of warming of 3–5°C that will destroy most species, most people and most of the world’s ecosystems; a set of impacts some more forthright scientists say are incompatible with the maintenance of human civilisation.
Or we can conceive of a safe-climate emergency-action approach which would aim to reduce global warming back to the range of conditions experienced during the last 10,000 years, the period of human civilisation and fixed settlement. This would involve fast and large emissions reduction through radical energy demand reductions, whilst a vast scaling-up of clean energy production was organised, together with the remaking of many of our essential systems such as transport and food production, with the target being zero net emissions. In addition, there would need to be a major commitment to atmospheric carbon dioxide drawdown measures. This would need to be done at a speed and scale more akin to the “war economy”, where social and economic priority is given to what is perceived to be an overwhelming existential threat.
After 30 years of climate policy and action failure, we are in deep trouble and now have to throw everything we can muster at the climate challenge. This will be demanding and disruptive, because there are no longer any non-radical, incremental paths available.
Prof. Kevin Anderson and Dr Alice Bows, writing in the journal Nature, say that “any contextual interpretation of the science demonstrates that the threshold of 2°C is no longer viable, at least within orthodox political and economic constraints” and that “catastrophic and ongoing failure of market economics and the laissez-faire rhetoric accompanying it (unfettered choice, deregulation and so on) could provide an opportunity to think differently about climate change” (17).
Anderson says there is no longer a non-radical option, and for developed economies to play an equitable role in holding warming to 2°C (with 66% probability), emissions compared to 1990 levels would require at least a 40% reduction by 2018, 70% reduction by 2024, and 90% by 2030. This would require “in effect a Marshall plan for energy supply”. As well low-carbon supply technologies cannot deliver the necessary rate of emission reductions and they need to be complemented with rapid, deep and early reductions in energy consumption, what he calls a radical emission reduction strategy (18). All this suggests that even holding warming to a too-high 2°C limit now requires an emergency approach.
Emergency action has proven fair and necessary for great social and economic challenges we have faced before. Call it the great disruption, the war economy, emergency mode, or what you like; the story is still the same, and it is now the only remaining viable path.
Notes
(1) Jaeger, C.C. and J. Jaeger (2011), “Three views of two degrees”, Reg. Environ. Change, 11: S15-S26; Anderson, K. and A. Bows (2012) “A new paradigm for climate change”, Nature Climate Change 2: 639-70
(2) http://www.bbc.co.uk/news/science-environment-19348194; http://www.guardian.co.uk/environment/2011/may/29/carbon-emissions-nuclearpow; http://www.smh.com.au/environment/weather/climate-pioneers-see-little-chance-of-avoiding-dangerous-global-warming-20131105-2wyon.html
(3) IPCC (2013) “Working Group I Contribution to the IPCC Fifth Assessment Report Climate Change 2013; The Physical Science Basis: Summary for Policymakers”
(4) “For a 90% probability of not exceeding 2C of warming the carbon budget had reduced to zero by 2012, using a multi-agent (that is, the well-mixed greenhouse gases, including CO2 and CH4)”, Raupach (2013, unpublished), based on Raupach, M. R., I.N. Harman and J.G. Canadell (2011) “Global climate goals for temperature, concentrations, emissions and cumulative emissions”, Report for the Department of Climate Change and Energy Efficiency. CAWCR Technical Report no. 42. Centre for Australian Weather and Climate Research, Melbourne; Rogelj, J., W. Hare et al. (2011) “Emission pathways consistent with a 2°C global temperature limit”, Nature Climate Change 1: 413-418 show at Table 1 no feasible pathways for limiting warming to 2°C during the twenty-first century with a “very likely” (>90%) chance of staying below the target, without carbon drawdown.
(5) Dunlop, I. (2011), “Managing catastrophic risk”, Centre for Policy Development,
http://cpd.org.au/2011/07/ian-dunlop-managing-catastrophic-risk/
(6) Raupach, M. R., I.N. Harman and J.G. Canadell (2011) “Global climate goals for temperature, concentrations, emissions and cumulative emissions”, Report for the Department of Climate Change and Energy Efficiency. CAWCR Technical Report no. 42. Centre for Australian Weather and Climate Research, Melbourne.
(7) Anderson, K. and A. Bows (2008) “Reframing the climate change challenge in light of post-2000 emission trends”, Phil. Trans. R. Soc. A 366: 3863-3882; Anderson, K. and A. Bows (2011) “Beyond ‘dangerous’ climate change: emission scenarios for a new world”, Phil. Trans. R. Soc. A 369: 20–44
(8) Wadhams, P. (2012) “Arctic ice cover, ice thickness and tipping points”, AMBIO 41: 23–33; Maslowski, W., C.J. Kinney et al. (2012) “The Future of Arctic Sea Ice”, The Annual Review of Earth and Planetary Sciences, 40: 625-654
(9) IPCC (2013) “Working Group I Contribution to the IPCC Fifth Assessment Report Climate Change 2013; The Physical Science Basis;
(10) Vaks, A., O.S. Gutareva et al. (2013) “Speleothems Reveal 500,000-Year History of Siberian Permafrost”, Science 340: 183-186; Schaefer, K., T. Zhang et al. (2011) “Amount and timing of permafrost carbon release in response to climate warming”, Tellus 63:165-180
(11) Anderson, K. and A. Bows (2011) “Beyond ‘dangerous’ climate change: emission scenarios for a new world”, Phil. Trans. R. Soc. A 369: 20–44
(12) Marcott, S.A, J.D. Shakun et al. (2013) “A Reconstruction of Regional and Global Temperature for the Past 11,300 Years”, Science 339: 1198-120; Hansen, J., P. Kharecha et al. (2013) “Assessing ‘dangerous climate change’: Required reduction of carbon emissions to protect young people, future generations and nature”, Plos One 8: 1-26
(13) Tripadi, A.K., C.D. Roberts et al. (2009), “Coupling of CO2 and Ice Sheet Stability Over Major Climate Transitions of the Last 20 Million Years”, Science 326: 1394-1397
(14) Rohling, E. J.,K. Grant et al. (2009) “Antarctic temperature and global sea level closely coupled over the past five glacial cycles”, Nature GeoScience, 21 June 2009 `af
(15) NASA (2014), “NASA-UCI Study Indicates Loss of West Antarctic Glaciers Appears Unstoppable”, Media release, 12 May 2014, http://www.nasa.gov/press/2014/may/nasa-uci-study-indicates-loss-of-west-antarctic-glaciers-appears-unstoppable, accessed 19 May 2014; Rignot, E., J. Mouginot et al. (2014) “Widespread, rapid grounding line retreat of Pine Island, Thwaites, Smith and Kohler glaciers, West Antarctica from 1992 to 2011”, Geophysical Research Letters, doi: 10.1002/2014GL060140; Joughin, I., B.E. Smith et al. (2014), “Marine Ice Sheet Collapse Potentially Under Way for the Thwaites Glacier Basin, West Antarctica”, Science 344: 735 -738
(16) NASA (2014), “Hidden Greenland Canyons Mean More Sea Level Rise”, Media release, 19 May 2014, http://www.nasa.gov/press/2014/may/hidden-greenland-canyons-mean-more-sea-level-rise, accessed 19 May 2014; Morlighem, M., E. Rignot et al. (2014), “Deeply incised submarine glacial valleys beneath the Greenland ice sheet”, Nature Geoscience, doi:10.1038/ngeo2167
(17) Anderson, K. and A. Bows (2012) “A new paradigm for climate change”, Nature Climate Change 2: 639-70
(18) Anderson, K. (2014) “Why carbon prices can’t deliver the 2°C target”, 13 August 2013, http://kevinanderson.info/blog/why-carbon-prices-cant-deliver-the-2c-target, accessed 19 May 2014; Anderson, K. (2012) “Climate change going beyond dangerous – Brutal numbers and tenuous hope”, Development Dialogue, September 2012; Anderson, K. (2011) “Climate change going beyond dangerous – Brutal numbers and tenuous hope or cognitive dissonance”, presentation 5 July 2011, slides available at http://www.slideshare.net/DFID/professor-kevin-anderson-climate-change-going-beyond-dangerous; plus (7) above.

Litium-ion storage in a cupboard http://www.theage.com.au/comment/renewables-race-is-one-australia-should-win-20140521-zrjp7.html … @Tjurkurrpa @Lee_Tennant Grid will be redundant @DennisJensenMP