Author: Neville

  • Ice Sheets and Sea level: what past climate change tells us is likely


    SF Bay Area Indymedia indymedia
    About Contact Subscribe Calendar Publish Print Donate

    International | Peninsula | Environment & Forest Defense

    Ice Sheets and Sea level: what past climate change tells us is likely
    by Takver – Climate IMC
    Friday Dec 13th, 2013 10:31 PM

    Paleoclimate shows us that sea level rise could become catastrophic with rises of 3 feet per 20 years seen as possible. “We are still potentially underestimating the instability of the ice sheets” informs Stefen Rahmstorf, Professor of Physics of the oceans from Postdam University in a video interview. “The IPCC has greatly revised it’s estimates of how unstable the Greenland ice sheet was.”

    the_poles_are_getting_warmer.jpg
    the_poles_are_getting_war…

    The video by Peter Sinclair and the Yale Forum on Climate Change and the Media shows a number of climate scientists interviewed discussing sea level rise, ice sheet collapse and past examples in paleoclimate history.

    Climate scientist Dr Richard Alley from Penn State University in a graph illuminates us that on current CO2 levels we can expect sea level rise to impact 10 per cent of the Earth’s population, hundreds of millions of people. He says in the video that “Greenland is very tightly tied to temperature, and if it gets too hot, it goes away”.

    Research published in March 2012 showed that the Global Warming threshold for Greenland Ice Sheet collapse is about 1.6 degrees C, although we may be seeing the start right now. The researchers said “We estimate that the warming threshold leading to a monostable, essentially ice-free state is in the range of 0.8-3.2 °C, with a best estimate of 1.6 °C”.

    The lower end of that range is where we are now, and due to inertia in the climate system we have the same amount of warming in the pipeline. So we are probably aleady committed to disintegration of the Greenland Ice Sheet.

    “Too hot is not too many degrees from where we are now”, said Dr Alley.


    Arctic and Antarctic warming linked

    Down at the bottom of the world, Antarctica is also showing signs of big changes in ice mass loss. Michael Studinger from NASA Operation Ice Bridge says “The ice sheets, for example like Pine Island Glacier (PIG) are rapidly thinning. And the thinning is rapidly accelerating and it is spreading further and further inland.”

    In Antarctica warmer ocean currents appear to be a primary driving force for destabilizing ice sheets as they eat away at the ice shelves that restrain the large ice streams like the Thwaites, Pine Island Glaciers and other ice streams around the continent.

    Latest research published 11 December 2013 in Global and Planetary Change by S.Jevrejevaa et al in a paper titled Trends and acceleration in global and regional sea levels since 1807 shows that global sealevel rise is accelerating at rate of 0.02 ± 0.01 mm/yr (1807–2009) with the Fastest sea level rise in Arctic (3.8 mm / yr) and Antarctica (3.5 mm / yr).


    Paleoclimate shows how fast ice sheets can collapse raising sea levels

    James Hansen highlights that the last time atmospheric temperatures were 2 to 3 degrees warmer, sea levels were 25 metres higher. With great inertia in the earth’s climate system, We are stretching the elastic which will rebound to a new sea level with devastating consequences. Scientists have estimated that at slightly above current temperatures we are about 20 metres below what the sea level equilibrium should be.

    Two years ago in a press conference at the American Geophysical Union Fall meeting 2011 in San Fransisco climate scientists James Hansen, Ken Caldeira and Eelco Rohling explained that the climate sensitivity may be greater than previously thought with the paleoclimate record pointing towards potential rapid climate change.

    The data range on the rate of accelerating mass loss is still too short to determine whether ice sheet mass loss will follow a somewhat linear path, or an exponential path doubling every 10 years or shorter time period. If it’s the later, we may face massive sea level rises later this century, according to a December 2012 discussion paper by James Hansen


    Link between Arctic and Antarctic warming periods

    The East Antarctic Ice sheet which sits on a high plateau was also much smaller and probably contributed 10 metres to sea level rise. Lead researcher Carys Cook was interviewed in the Sinclair video. The research was published in Nature Geoscience in July 2013 as Dynamic behaviour of the East Antarctic ice sheet during Pliocene warmth (abstract). From the abstract:


    “The geochemical provenance of detrital material deposited during these warm intervals suggests active erosion of continental bedrock from within the Wilkes Subglacial Basin, an area today buried beneath the East Antarctic ice sheet. We interpret this erosion to be associated with retreat of the ice sheet margin several hundreds of kilometres inland and conclude that the East Antarctic ice sheet was sensitive to climatic warmth during the Pliocene.”

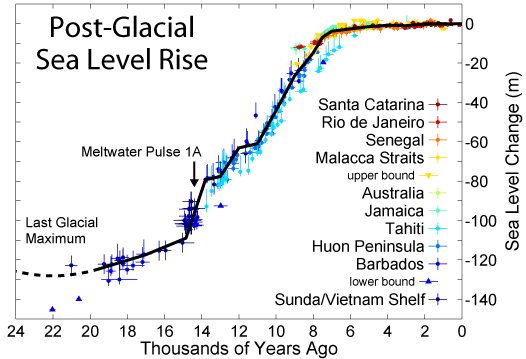
    Carys Cook described that the East Antarctic ice sheet must have retreated several hundred kilometres inland. She described the implications for sea level in the interview with Peter Sinclair:

    “There was no ice on Greenland and that accounts for about 5 metres of sea level. The West Antarctic Ice sheet as well was probably gone and that accounts for about 5 or 6 metres of global sea level. The retreat from the East Antarctic Ice sheet gave an extra 10 metres of global sea level. So in total we are looking at between 20 and 22 metres higher than they are today.”

    Peter Sinclair also gives us a clip of James Hansen in 2009 explaining: “Now that wouldn’t happen instantly, but we could get several metres of sea level rise in one century. In fact the last time ice sheets disintegrated was 14,000 years ago when sea levels went up 20 metres in 400 years. So that is one metre every 20 years.”


    20131214-Post-Glacial_Sea_Level.png

    The Pliocene was also much warmer in the Arctic, with extreme warm periods, as Geology ProfessorJulie Brigham-Grette explains in the video. You can watch a July 2012 24 minute Youtube presentation by Brigham-Grette on Lake El’ gygytgyn Research in Siberia.

    These extreme warm periods in the Arctic also correspond with warm periods in Antarctica. Brigham-Grette, the lead U.S. scientist said in a media release July 2012:


    “What we see is astonishing. We had no idea that we’d find this. It’s astonishing to see so many intervals when the Arctic was really warm, enough so forests were growing where today we see tundra and permafrost. And the intensity of warming is completely unexpected. The other astounding thing is that we were able to determine that during many times when the West Antarctic ice sheet disappeared, we see a corresponding warm period following very quickly in the Arctic. Arctic warm periods cluster with periods when the Western Antarctic ice sheet is gone.”

    Brigham-Grette’s team examined in detail four warm phases; two of the oldest warm interglacials from about 1.1 million years ago and 400,000 years ago, and two of the youngest from 125,000 and about 12,000 years ago.

    Peter Sinclair’s video ends with a video interview with Brigham-Grette in which she says,


    “The value of our record is looking at the fact that the Arctic can become very quickly as warm, and that warmer environment is reaching a point where increasing melt of places like Greenland and the West Antarctic Ice Sheet are almost inevitable.”


    Creation stories remember significant sea level rise 14,000 to 12,000 years ago

    Here in Australia we have memories of that last significant rise in sea level between 14,000 and 12,000 years ago when the land bridge between mainland Australia and Tasmania was flooded along with areas of Port Philip.

    The memories are preserved in the oral and spiritual traditions of the Australian first peoples in the Kulin nation of southern Victoria. Oral history and creation stories from the Wada wurrung, Woiwurrung and Bun wurrung languages from around present day Melbourne describe the flooding of Hobsons Bay and Port Philip, once a productive kangaroo hunting ground. Creation stories describe how Bunjil was responsible for the formation of the bay, or the bay was flooded when the Yarra river was created (Yarra Creation Story.)

    While sea level rise is inevitable and now unstoppable, Federal and State Governments in Australia are withdrawing from co-ordinated coastal planning leaving this responsibility more and more to local municipal councils.

    What will our new stories say if sea level rises again at the rate of a metre every 20 years resulting in the wholesale dereliction and abandonment of coastal housing and infrastructure?

    How will we deal which the mass migrations of people? Will Prime Minister Tony Abbott’s slogan of Stop the Boats still be parroted?


    Sources

  • Government approves massive resource projects on Great Barrier Reef coast

    Government approves massive resource projects on Great Barrier Reef coast

    Dunk Island, on the Great Barrier Reef.Dunk Island, on the Great Barrier Reef.

    Several massive resource projects have been approved on the Great Barrier Reef coast by the federal government including the dredging and dumping of spoil near the reef and a new coal export terminal.

    Environmentalists have hit out at the decision, with the WWF and the Greens saying it further industrialises and threatens the world heritage protected icon.

    The projects approved by Environment Minister Greg Hunt late on Tuesday include the dredging of 3 million cubic metres of spoil – which will be dumped in the reef’s waters – for the development of three coal export terminals at Abbot Point.

    Mr Hunt also approved the building of a new coal terminal at Abbot Point by Indian mining giant Adani.

    Advertisement

    Approval was also given to a new processing plant for coal seam gas on Curtis Island, which includes 1.4 million cubic meters of dredging at Port Curtis and the mouth of the Calliope River near Gladstone. A pipeline to the plant – being proposed by Arrow Energy – was also approved.

    In making the decision Mr Hunt said he had imposed 148 strict environmental conditions on the Abbot Point and Curtis Island developments. That included conditions to ensure the water quality impact from the dumping of dredging spoil was offset. Mr Hunt said the offsets – which would stop sediments entering the Great Barrier Reef marine park from land sources such as farm runoff – would require an overall gain in water quality.

    “It is important to note that each of these sites is already heavily industrialised and that the processes were highly advanced at the change of government,” Mr Hunt said.

    “The conditions I have put in place for these projects will result in an improvement in water quality and strengthen the Australian Government’s approach to meeting the challenges confronting the Reef into the future”

    Water quality is a significant problem for the Great Barrier Reef with increasing pollutants and nutrients resulting in damage to corals, sea grass and other important marine habitats. There is also emerging evidence poor water quality can encourage populations of a damaging starfish know as crown-of-thorns that has plagued the reef.

    The World Heritage Committee has also been alarmed by increasing development on the reef’s coast – with a number of major resource projects approved in recent years – and will consider in 2014 whether it should be placed on an “in danger” list of world heritage sites.

    Richard Leck from WWF said Mr Hunt had failed the reef and had turned his back on scientific evidence of the damage dredging would cause.

    “Approving a massive amount of sediment to be dumped at a time when the reef’s health is so low, it really is against what the science tells us,” he said.

    Queensland Resources Council Chief Executive Michael Roche welcomed the decision and said it confirmed that industry could co-exist with the reef.

    Advertisement

    Environment News Video More video

    ‘Hurricane’ winds batter Europe

    Hurricane-force winds from a storm dubbed ‘Xaver’ have blasted toward

  • Awesome fossil fuel burning is defying the past and defining the future

    Awesome fossil fuel burning is defying the past and defining the future

    More fossil fuel projects approved in Australia as geologists say there’s no precedent for current speed of carbon dioxide releases
    Abbot Point

    Abbot Point coal port in Queensland which is targeted for expansion: Image Greenpeace/Tom Jefferson

    We’re doing some pretty awesome things here in Australia as part of a global movement that is both history defying and future shaping.

    Just to be clear though, when I say “awesome” I mean it in the context in which it’s not often used these days.

    This “awesome” is the one that might evoke fear and dread. Like the awesome power of a cyclone or the awesome size of a mega-coal mine.

    This week, Australia showed its mettle again, when Environment Minister Greg Hunt approved four projects on the Great Barrier Reef coastline that are part of an attempt to liberate hundreds of millions of tonnes of coal and gas.

    Two of the approvals help the expansion of the Abbot Point coal export facilities in north Queensland, near Bowen and the Whitsunday Islands. This is mainly to dig coal from massive planned mines in the Galilee Basin for export and burning.

    The T0 coal terminal, if built, is a project of the Indian energy group Adani and will be able to export as much as 70 million tonnes of coal per year. The coal would come from Adani’s planned giant Carmichael mine in the Galilee Basin, which, if built, would be one of the biggest coal mines in the world.

    As I’ve outlined before, the coal planned to be dug up from two other Galilee mines would emit about 3.7 billion tonnes of CO2 – that’s about six years worth of the emissions of Australia or the UK.

    With a long list of conditions which it is claimed will protect the reef and local habitat, Hunt has approved the dredging of up to three million cubic metres of material from the ocean bottom for the new coal terminal. The dredged material will be dumped in the ocean, putting more pressure on the Great Barrier Reef which already has an uncertain future.

    The other two approvals are part of Queensland’s rapid multi-billion dollar expansion of the contentious coal seam gas industry.

    Given the go ahead are a nine-kilometre pipeline to get the gas from Gladstone to Curtis Island and a new plant there to compress the gas and export up to 18 million tonnes a year of liquified natural gas. Both projects are owned by Arrow Energy (jointly owned by Shell and PetroChina).

    Eleven million Melbourne Cricket Grounds

    But these decisions are just part of an awesome effort in the last 250 years or so to dig up and burn fossil fuels that have powered our modern lives.

    What has this effort achieved in a historical context, in terms of smacking our climate around the chops?

    Between 1750 and 2012, according to the Global Carbon Project, our fossil fuel burning has emitted about 1,407 billion tonnes (gigatonnes) of carbon dioxide.

    This year, the Global Carbon Project says we will likely reach an all time high of emitting about 36 billion tonnes of CO2 from fossil fuel burning and cement making.

    That’s a difficult number to visualise.

    To give us an idea of just how much CO2 that actually is,  geologist Derek Taylor has calculated that one gigatonne of CO2 is enough to fill the Melbourne Cricket Ground 300,000 times.

    That means emissions this year from fossil fuel burning would create enough carbon dioxide to fill about 11 million MCGs or 16 million Wembley stadiums.

    History making

    Efforts like the coal and gas extraction in Australia are helping to push the concentration of carbon dioxide in the atmosphere to almost 400 parts per million.

    Levels like this have not been seen on earth since the Pliocene era, which ended about 2.6 million years ago.

    As Dr Andrew Glikson of the Australian National University has explained, during the Pliocene the world’s average temperature was between 1C and 3C higher than it is today.

    The rate at which CO2 concentrations are rising has not been recorded for at least 65 million years, says Glikson, when a chunk of rock thought to have been about 10 kilometres wide hit the earth and scrubbed out half or more of the species on the planet.

    The Geological Society in the UK, the world’s oldest geological group, has just updated its climate change statement to take account of new scientific findings.

    The society says the speed that CO2 concentrations are rising in the atmosphere is now “unprecedented” – and they too have looked a long way back for a precedent. The society says:

    …  the rates of increase of CO2 since 1970 are unprecedented, even in comparison with the massive injections of carbon to the atmosphere at the Palaeocene-Eocene boundary, which led to a major thermal event 55 million years ago.

    In some places on earth during the Pliocene, when CO2 levels in the atmosphere were similar to today, the society says after hundreds of years sea levels went up 20 metres in some places.

    If emissions keep rising, then the society says the earth will have levels of CO2 in the atmosphere that have not been experienced for 24 million years or more.

    Awesome or what?

  • East Antarctica Is Sliding Sideways: Ice Loss On West Antarctica Affecting Mantle Flow Below

    Science News

    … from universities, journals, and other research organizations

    East Antarctica Is Sliding Sideways: Ice Loss On West Antarctica Affecting Mantle Flow Below

    Dec. 11, 2013 — It’s official: East Antarctica is pushing West Antarctica around.


    Share This:

    Now that West Antarctica is losing weight–that is, billions of tons of ice per year–its softer mantle rock is being nudged westward by the harder mantle beneath East Antarctica.

    The discovery comes from researchers led by The Ohio State University, who have recorded GPS measurements that show West Antarctic bedrock is being pushed sideways at rates up to about twelve millimeters–about half an inch–per year. This movement is important for understanding current ice loss on the continent, and predicting future ice loss.

    They reported the results on Thursday, Dec. 12 at the American Geophysical Union meeting in San Francisco.

    Half an inch doesn’t sound like a lot, but it’s actually quite dramatic compared to other areas of the planet, explained Terry Wilson, professor of earth sciences at Ohio State. Wilson leads POLENET, an international collaboration that has planted GPS and seismic sensors all over the West Antarctic Ice Sheet.

    She and her team weren’t surprised to detect the horizontal motion. After all, they’ve been using GPS to observe vertical motion on the continent since the 1990’s.

    They were surprised, she said, to find the bedrock moving towards regions of greatest ice loss.

    “From computer models, we knew that the bedrock should rebound as the weight of ice on top of it goes away,” Wilson said. “But the rock should spread out from the site where the ice used to be. Instead, we see movement toward places where there was the most ice loss.”

    The seismic sensors explained why. By timing how fast seismic waves pass through Earth under Antarctica, the researchers were able to determine that the mantle regions beneath east and west are very different. West Antarctica contains warmer, softer rock, and East Antarctica has colder, harder rock.

    Stephanie Konfal, a research associate with POLENET, pointed out that where the transition is most pronounced, the sideways movement runs perpendicular to the boundary between the two types of mantle.

    She likened the mantle interface to a pot of honey.

    “If you imagine that you have warm spots and cold spots in the honey, so that some of it is soft and some is hard,” Konfal said, “and if you press down on the surface of the honey with a spoon, the honey will move away from the spoon, but the movement won’t be uniform. The hard spots will push into the soft spots. And when you take the spoon away, the soft honey won’t uniformly flow back up to fill the void, because the hard honey is still pushing on it.”

    Or, put another way, ice compressed West Antarctica’s soft mantle. Some ice has melted away, but the soft mantle isn’t filling back in uniformly, because East Antarctica’s harder mantle is pushing it sideways. The crust is just along for the ride.

    This finding is significant, Konfal said, because we use these crustal motions to understand ice loss.

    “We’re witnessing expected movements being reversed, so we know we really need computer models that can take lateral changes in mantle properties into account.”

    Wilson said that such extreme differences in mantle properties are not seen elsewhere on the planet where glacial rebound is occurring.

    “We figured Antarctica would be different,” she said. “We just didn’t know how different.”

    Ohio State’s POLENET academic partners in the United States are Pennsylvania State University, Washington University, New Mexico Tech, Central Washington University, the University of Texas Institute for Geophysics and the University of Memphis. A host of international partners are part of the effort as well. The project is supported by the UNAVCO and IRIS-PASSCAL geodetic and seismic facilities.


  • Evidence of Mass Extinction Associated With Climate Change 375 Million Years Ago Discovered in Central Asia

    Science News

    … from universities, journals, and other research organizations

    Evidence of Mass Extinction Associated With Climate Change 375 Million Years Ago Discovered in Central Asia

    Dec. 13, 2013 — Members of a U.N.-sponsored research team with members from Appalachian State University’s Department of Geology have found evidence for catastrophic oceanographic events associated with climate change and a mass extinction 375 million years ago that devastated tropical marine ecosystems.


    Share This:

    “The Late Devonian mass extinction was one of the five largest mass extinction events in the history of life,” said Professor Johnny Waters, who is a co-leader of the five-year, U.N. International Geoscience Programme project that began in 2011. The research team, which includes Assistant Professor Sarah Carmichael, is examining the relationship between climate change and changes in the ecosystems in the Devonian period, from 419 to 359 million years ago.

    “This is the third most significant mass extinction and it was caused by plants,” Waters said. “Unlike the dinosaur mass extinction, which was related to an asteroid impact, this one was environmentally related.”

    In the Devonian period, Waters explained, the world was experiencing super greenhouse climate conditions. This means that it was very warm, there probably were no ice caps, there was a lot carbon dioxide in the atmosphere (with estimates of 4,000 parts per million).

    “As plant communities expanded onto land to form the first forests, they depleted the carbon dioxide (CO2) that was in the atmosphere,” Waters said. “CO2 levels dropped to 400 ppm toward the end of the Devonian. It got colder. There were glaciation events and the rapid change in the climate caused severe extinction in the tropics and the existing coral reefs became extinct.” By comparison, the world’s current CO2 level is very close to 400 ppm.

    Most of the knowledge that geologists have about this mass extinction comes from North America and Europe. Although these two land masses are far apart now, in the Devonian they were very close to each other. Scientists have tried to make inferences about worldwide events based on sample locations that are really quite limited in terms of their geographic history, or paleogeography. Therefore, it is vitally important to obtain samples from locations outside this region for understanding global climate change during this time period.

    Waters’ international team of geoscientists has conducted field work in remote areas of western China for many years, in addition to two recent field seasons in western Mongolia near the Russian and Chinese borders. The changing political climate in China, Russia and Mongolia in recent years has now made it possible to do fieldwork in these locations. The strength of these field collaborations is that they draw on the expertise of scientists from a variety of disciplines to add critical climatic information to a limited database. U.N. researchers associated with this project are also collecting related data in Thailand, Myanmar, Vietnam and Northern China.

    “The reason we are working in central Asia is that there is a lot of good evidence of what happened at and after this mass extinction — this is an area that has not been well studied,” Waters said. “It’s all a part of our work finding the places that give us the best information in sorting out what happened in the extinction event and in its aftermath.”

    Answers about Earth’s climate during and after this mass extinction are contained within rock samples from these new field sites, which were once part of the ocean floor, as geochemical signals preserved in the rocks record devastating climate change. The paleogeography of the field sites indicate that Devonian climate change not only had environmental impacts on life associated with large land masses, but also on life in the open ocean.

    “We now have evidence that the radiation of surviving life following the mass extinction was centered in Central Asia,” Waters said.

    The geochemistry of the samples is being analyzed primarily by students in Appalachian’s Department of Geology under Carmichael’s supervision, with additional analyses being conducted at UNC-Chapel Hill and a university in Austria. “We are using geochemistry to tie it all together all across Central Asia, which used to be an open ocean, and compare our new data to established sequences in Europe and North America, in order to develop a global understanding of the climate change associated with this mass extinction,” Waters said.

    “Today we are looking at increases in carbon dioxide causing warming and the negative impacts to the ecosystem. In the Devonian period, we are looking at a rapid loss of carbon dioxide, which in geologic time occurred over millions of years rather than hundreds of years,” Waters said. “But the lessons are actually quite similar. We clearly are concerned today about climate change and its impact on the environment and its effect on the ecosystem, and the geologic record is really the only record where we can see these events and compare what happened before and after.”

    Waters and Carmichael will present the preliminary results of their research at the Geological Society of America’s Annual Meeting in Denver in October and at the American Geophysical Union’s annual meeting in San Francisco in December.

    Next summer, Waters will lead a 20-member team, including Dr. Sarah Carmichael and two students from Appalachian’s Department of Geology, for continued field work in Mongolia.


  • Melting ice a ‘sleeping giant’ that will push sea levels higher, scientist says

    John Roach NBC News

    13 hours ago

    Image of icebergs in Greenland

    Joe Raedle / Getty Images
    This file photo shows the village of Ilulissat in Greenland near icebergs that broke off from the Jakobshavn Glacier on July 24

    By the time today’s preschoolers are babysitting their grandkids, global sea levels are likely to be pushing 2 feet higher than they are now and on the way to topping 8 feet above current levels by the year 2200, according to a new study.

    The finding stems from geologic evidence that allowed scientists to tease apart a natural background pattern of how fast and how high sea levels rose as ice ages came and went over the past 2 million years.

    Today’s pace of sea level rise is about twice as fast compared to historical standards, the team concluded. Going forward, seas will be pushed higher as rising temperatures force the great ice sheets in Greenland and Antarctica to disintegrate, glaciers around the world to retreat toward mountaintops, and warming ocean waters to expand, the study notes.

    “We have awoken a sleeping giant,” Eelco Rohling, a climate scientist at the Australian National University in Canberra, told NBC News in an email. “He is now here to stay.” To stand a chance at halting the rise and preserving today’s coastal cities, he added, “We must virtually immediately take measures of carbon reduction.”

    Sleeping giant
    The sleeping giant is the loss of ice in Greenland and Antarctica, a process that is slow to start and slow to stop. “We cannot expect that, once moving, big ice masses will screech to a halt,” he explained. “So we better get used to sea level rising, and rising increasingly quickly.”

    The rise won’t stop until the seas are about 25 to 30 feet higher than they are today. And that’s assuming atmospheric concentrations of the greenhouse gas carbon dioxide stabilize at around 400 parts per million, a milestone that was crossed in May for the first time in more than 3 million years.

    The finding, reported this week in the journal Scientific Reports, is consistent with the amount of sea level rise the United Nations’ Intergovernmental Panel on Climate Change said is likely under a so-called business-as-usual scenario where no action is taken to curb global greenhouse gas emissions.

    “The study confirms, from a geological perspective, that our current greenhouse gas emissions are committing our planet to a sea level rise of several meters,” Stefan Rahmstorf, an expert on sea level rise at the Potsdam Institute for Climate Impact Research in Germany, told NBC News in an email. He was not involved with the new study.

    ‘Normal’ response
    Rohling, who studies the geological records of ancient climates, and colleagues, compared their data to historical tide-gauge and satellite observations since coal-powered machinery revolutionized industry in the 18th century.

    They found that the current rate of rise is about two times faster than it was during any other period between ice ages, known as interglacials. However, variables that force temperatures higher, such as greenhouse gases, are increasing 10 times faster today than at any time prior to the industrial revolution.

    “It is not a given that” the faster rise of greenhouse gas emissions “must result in a faster response of sea level rise because ice sheets are very slow,” Rohling explained. “One could easily imagine that the processes of ice decay would limit how fast sea level rise can take place, no matter how fast the” greenhouse gases increase.

    In fact, the current pace of sea level rise is on the high end of “normal,” given what is known about the physical processes that govern the loss of ice in Greenland and Antarctica, the team found.

    “This is interesting, because that might indicate that we understand ice physics well enough, and that we do not yet have to start thinking about processes that we don’t understand, or even know about,” Rohling said.

    Such processes could, for example, be the disintegration of the East Antarctic Ice Sheet, which is currently stable. Several studies indicate that the ice there could disappear when atmospheric carbon dioxide concentrations reach 1,000 parts per million. If that happens, Rohling noted, “then all bets are off.”

    John Roach is a contributing writer for NBC News. To learn more about him, visit his website.