Historical sea level changes
Last two decades
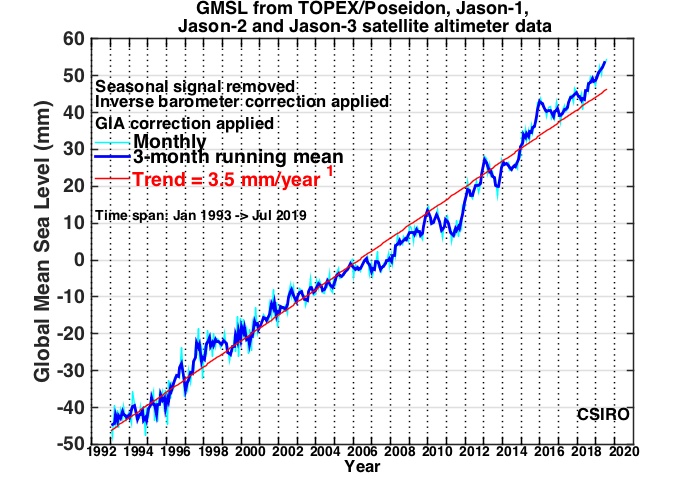
High quality measurements of (near)-global sea level have been made since late 1992 by satellite altimeters, in particular, TOPEX/Poseidon (launched August, 1992), Jason-1 (launched December, 2001) and Jason-2 (launched June, 2008). This data has shown a more-or-less steady increase in Global Mean Sea Level (GMSL) of around 3.2 ± 0.4 mm/year over that period. This is more than 50% larger than the average value over the 20th century. Whether or not this represents a further increase in the rate of sea level rise is not yet certain.
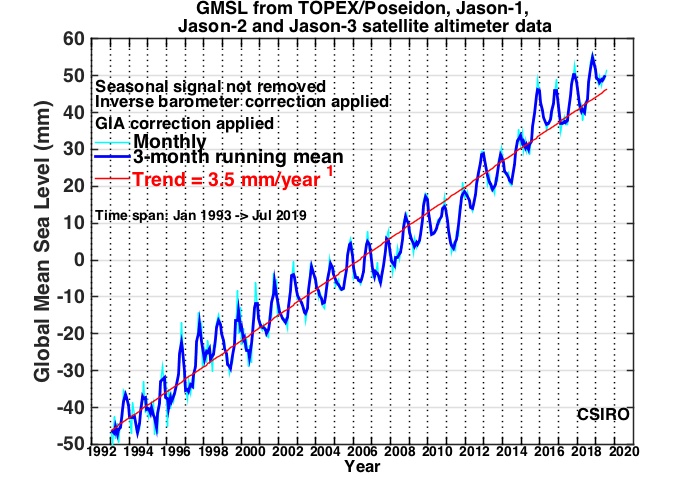
The two plots below show the GMSL measured from TOPEX/Poseidon, Jason-1 and Jason-2.
This one shows it with the seasonal signal removed:
And this shows it with the seasonal signal left in:
Sea level and El Niño
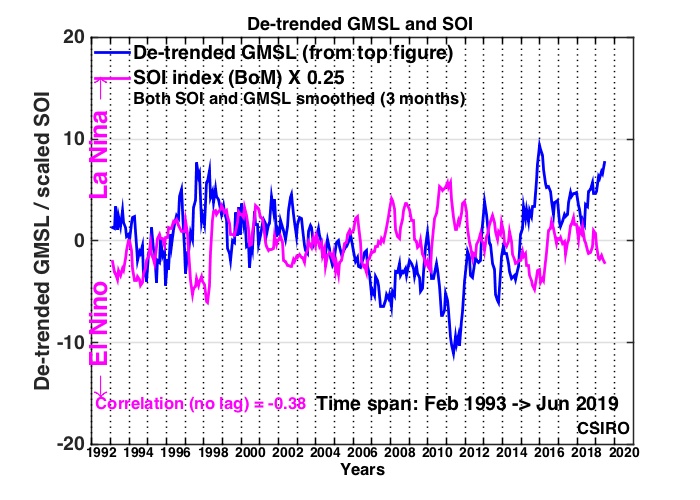
There are a number of changes of slope over short periods in the GMSL record. This variability is at least partly related to El Niño and La Niña (sea level rises during El Niño and falls during La Niña) and associated changes in the hydrological cycle.
The above graph shows detrended GMSL (from the top graph) versus the Southern Oscillation (SOI) index, which is one of the common indexes of the El Niño/La Niña cycle.
Clearly (see, e.g. 1997/1998) sea level is higher during an El Niño event (SOI -ve) and lower (see, e.g. 1999/2000 and 2010/2011) during La Niña (SOI +ve).
SOI data is from the Australian Bureau of Meteorology and data and graphs can be downloaded and seen at the Bureau of Meterology’s web site.
Regional trends
Sea level does not rise (or fall) uniformly over the oceans. This is illustrated by the map (below) showing sea-level trends from 1993 to 2012. There is a clear pattern of sea-level change that is also reflected in patterns of ocean heat storage.
This pattern reflects interannual climate variability associated with the El Niño/La Niña cycle and the Indian Ocean Dipole, but also longer term changes such as the increase in sea levels in the Western Tropical Pacific due to changes in the Trade Winds. During El Niño years sea level rises in the eastern Pacific and falls in the western Pacific, whereas in La Niña years the opposite is true.
Movie of sea-level changes (2.8MB animated gif) over the last 20 years – this version has had the seasonal (annual+semi-annual) signal removed at each point. This is comparable to the top figure (above).
Click on the map below to see a movie of monthly-mean sea-surface height from January 1993 to April 2013 with the seasonal signal removed. The plot at the top of the page shows the time series of the means of these fields.
The data that is displayed here can be downloaded from the “Sea level data>Data downloads” page on this site.
Note the 1997/98 El Niño event!
Another movie of sea-level changes (2.9MB animated gif) over the last 20 years
Click on the map below to see a movie of monthly-mean sea-surface height from January 1993 to April 2013. The seasonal signal has not been removed from this, so you should see the pumping as the water in each hemisphere warms and expands in Spring and Summer and cools and shrinks in Autumn and Winter. The second plot (above) shows the time series of the means of these fields.
The data that is displayed here can be downloaded from the “Sea level data>Data downloads” page on this site.
Note especially the 1997/98 El Niño event!
|


Leave a Reply
You must be logged in to post a comment.