Updating the Climate Science
What Path is the Real World Following?
Makiko Sato & James Hansen
Columbia University
web page maintained by Makiko Sato (mhs119@columbia.edu)
Our aim is to help people understand global climate change — and how the factors that drive climate are changing.
We start with climate diagnostics — people are usually most interested in climate change itself. But cause-and-effect analysis requires also data on climate forcings (which drive climate change) and feedbacks (which amplify or diminish climate change).
We update graphs of “Storms of My Grandchildren.” Yet the greatest insight about processes discussed in “Storms” is often provided by other quantities, for example, the rate of ice sheet disintegration. We include some data from other scientists or their web sites, as indicated.
Continual updating of data curves, whether global temperature, the Greenland ice sheet mass, the sun’s brightness, Keeling’s carbon dioxide record, or other more obscure quantities, is a most interesting aspect of science. Sometimes data curves follow an expected path, sometimes not, but we usually learn something. As Richard Feynman said, there is a pleasure of finding things out.
That pleasure is now mixed with concern. Humans are altering the measured curves. But whether climate change will be moderate — something humans and most species can adjust to — or whether climate change accelerates and spins out of control, with devastating consequences for future generations — that depends.
Future climate depends on how climate forcings change — human-made greenhouse gases, especially carbon dioxide, and forcings that are not yet well measured, especially aerosols. The speed and degree of climate change also will depend upon how fast amplifying feedbacks, such as Arctic sea ice, the large ice sheets, and methane hydrates come into play.
Construction of this web site is just beginning. But already there are interesting new data.
“Storms of My Grandchildren” by James Hansen
- stormsofmygrandchildren.com Page
- Figures of “Storms” in Color
- Updated Figures (updated 2012/07/06)
- Errata (last modified 2011/02/28)
Critical Climate Diagnostics and Feedbacks
- Global Temperature (last modified 2012/07/16)
- Sea Level (last modified 2012/06/26)
- Ice Sheet Disintegration (last modified 2011/01/31)
- Sea Ice Area (last modified 2012/08/02)
Climate Forcings
- Carbon Dioxide Emissions (last modified 2012/06/28)
- Renewable Energy (last modified 2012/02/28)
- Greenhouse Gas Forcing (last modified 2012/03/29)
- Solar Irradiance (last modified 2012/08/01)
- Stratospheric Aerosols (last modified 2011/06/29)
Recent Publications

Target CO2 (2008)
- “Target Atmospheric CO2: Where Should Human Aim?” published in The Open Atmospheric Science Journal
- Some figures and Paleoclimate Data (last modified 2011/04/25)

Global Temperature Change (2010)
- “Global Surface Temperature Change” published in Reviews of Geophysics
- Figures Only.

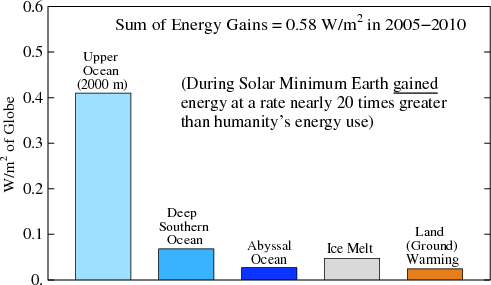
Earth’s Energy Imbalance (2011)
- “Earth’s Energy Imbalance and Implications” published in Atmospheric Chemistry and Physics
- Figures Only (last modified 2012/07/31)

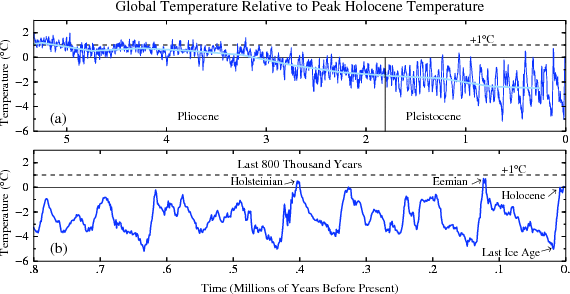
Paleoclimate Implications (2012)
- “Paleoclimate Implications for Human-Made Climate Change” published in Climate Change by Springer on June 15.
- Figures Only (last modified 2011/07/18)

Perceptions and Dice (2012)
- “Perception of Climate Change” will be published in PNAS Plus online in the week of August 6.
- Figures Only (last modified 2012/07/31)

Case for Young People (2012?)
- “Scientific Case for Avoiding Dangerous Climate Change to Protect Young People and Nature” submitted to Proc Nat Acad Sci USA in February 2012, and posted on arXiv on 2012/03/23.
- Figures Only (last modified 2012/02/03)

Climate Sensitivity (2012?)
- “Climate Sensitivity Estimated from Earth’s Climate History” submitted to Phil. Trans. R. Soc. A in May, 2012.
- Figures Only (last modified 2012/05/08)
