Mapping The 31 Million People Displaced By Climate Change So Far
This is what it looks like when floods, hurricanes, cyclones, and typhoons force millions of people to flee their homes.
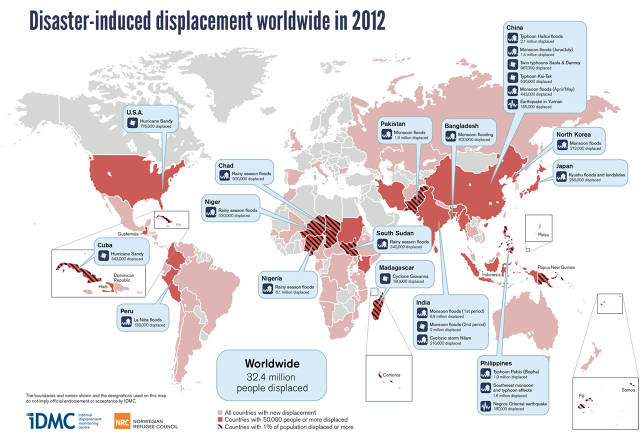
When natural disasters strike, people are forced move. The map here shows all the people displaced in 2012–mostly from floods, hurricanes, typhoons and cyclones. The map was created by Norwegian Refugee Council’s Internal Displacement Monitoring Centre, which for the last five years has been tracking movements following disasters.
You can see, for example, that monsoon floods displaced 1.9 million people in Pakistan, and that Hurricane Sandy caused 776,000 people in the U.S. to be evacuated. More than 32.4 million were displaced in 2012, with a good chunk of that coming in northeast India (6.9 million) and Nigeria (6.1 million), both of which saw major flooding. Over the last five years, Asia has seen 81% of the displacement, with five countries consistently seeing the most: China, India, Pakistan, the Philippines, and Nigeria.
 N.R.C. attributes 98% of the disasters to “climate- and weather-related events.” It expects things to only get worse as climate change increases “the frequency and severity of weather-related hazards.”
Both rich and poor countries are affected by extreme weather, but the former will cope better, it notes. “In the U.S. following Hurricane Sandy, most of those displaced were able to find refuge in adequate temporary shelter while displaced from their own homes,” says Clare Spurrell, spokesperson for the group, in a press release. “Compare this to communities in Haiti, where hundreds of thousands are still living in makeshift tents over three years after the 2010 earthquake mega-disaster, and you see a very different picture.”
It’s bad enough that climate change will cause forced movement and migration. It’s deeply unfair that the poorest will see the worst of it.
Leave a Reply
You must be logged in to post a comment.