Category: Uncategorized

  • Optional Battery Backup, December rollout plan and more

    Why this ad?
    McAfee Next Gen Firewallmcafee.com/NextGenFirewall – Proxy-Based Firewall Blocking The Latest Threats. Learn More Today!

    Optional Battery Backup, December rollout plan and more

    Inbox
    x
    NBN Co via bounce.marketing.nbnco.net.au
    1:49 PM (1 hour ago)

    to me
    You may view this email online if you prefer 
    NBN Co - Bringing broadband to life NEW CONNECTIONS
    Optional Battery Backup
    Optional Battery Backup

    From 19th December 2013, NBN Co will be providing you, our service providers, with the ability to offer your own customers a choice as to whether or not they have a battery backup as part of their NBN installation.

    Read More >
     Product Scorecards  Ten Minute Install Guide
    Product Scorecards

    NBN Co has recently completed the latest round of product scorecards which look at the connected user experience for NBN Co’s launched products: Fibre, Fixed Wireless and Interim Satellite.

    Read More >
    Ten Minute Install Guide

    NBN Co is updating the First 10 minute guide we provide to our installers to reference during an installation. The guide provides installers information and diagrams to reference with end users when completing an NBN fibre installation in their home.

    Read More >
    Switch over Commencement

    NBN Co provides information to you, our service providers, on the upcoming FSAMs that are forecast to commence switching over to fibre optic broadband. The switch over will occur over an 18-month period after a rollout region is declared Ready for Service (RFS). This information is now accessible from the NBN Co Notifications SharePoint site.

    Read More >
    Industry News

    In this month’s Industry News we showcase the latest Roy Morgan research, which looks at the proportion of Australians who stream or download TV, movie or video content online and do not watch live broadcast TV.

    Read More >
  • Nuclear scare stories are a gift to the truly lethal coal industry MONBIOT

    Nuclear scare stories are a gift to the truly lethal coal industry

    Coal is a much nastier power source than the one we have chosen to fear in a deadly form of displacement activity
    Beta
    china coal monbiot

    A man walks past a coal plant in Lingwu, northern China. ‘Research suggested by Greenpeace suggests that a quarter of a million deaths a year could be avoided if coal power [in China] were shut down.’ Photograph: Stringer/China/Reuters

    Most of the afflictions wrongly attributed to nuclear power can rightly be attributed to coal. I was struck by this thought when I saw the graphics published by Greenpeace on Friday, showing the premature deaths caused by coal plants in China. The research it commissioned suggests that a quarter of a million deaths a year could be avoided if coal power there were shut down. Yes, a quarter of a million.

    Were Greenpeace to plot the impacts of nuclear power on the same scale, the vast red splodges depicting the air pollution catastrophe suffered by several Chinese cities would be replaced by dots invisible to the naked eye.

    This is not to suggest that there are no impacts, but they are tiny by comparison. The World Health Organisation’s analysis of the Fukushima disaster concludes that “for the general population inside and outside of Japan … no observable increases in cancer rates above baseline rates are anticipated“. Only the most contaminated parts of Fukushima prefecture are exposed to any significant threat: a slight increase in the chances of developing cancer. Even the majority of the emergency workers have no higher cancer risk than that of the general population. And this, remember, was caused by an unprecedented disaster. The deaths in China are caused by business as usual.

    The tiny risk that is imposed by nuclear power has both obscured and invoked the far greater risk that is imposed by coal. Scare stories about nuclear power are a gift to the coal industry. Where they are taken seriously by politicians – as they have been in Japan – and cause a switch from nuclear to coal power, they kill people.

    Since the tsunami in 2011, the internet has been awash with ever more lurid claims about Fukushima. Millions have read reports claiming that children on the western seaboard of the United States are dying as a result of radiation released by the damaged plant. It doesn’t seem to matter how often and effectively the stories are debunked: they keep on coming. But children in the US really are dying as a result of pollution from coal plants, and we hear almost nothing about it.

    Plenty of reports also propose that the water on the Pacific coast of North America is now dangerous to swimmers, and the fish there too radioactive to eat. Again, it’s not true. Except in the immediate vicinity of the plant, any extra radiation to which fish in the Pacific are exposed is minute by comparison to the concentration in their tissues of polonium-210, which occurs naturally in seawater. There are, however, genuine dangers associated with another toxic contaminant found in fish: mercury. What is the primary source of mercury pollution? Ah yes, coal burning.

    In October, for the first time, the World Health Organisation officially listed both gaseous outdoor pollution and airborne particulates as carcinogenic to humans. Exposure levels, it notes, are rising sharply in some parts of the world. In 2010 an estimated 223,000 deaths from lung cancer were caused by air pollution.

    But these cancers, though wildly outstripping those correctly attributed to man-made radiation, are just a small part of the pollution problem. Far greater numbers are afflicted by other diseases, including asthma, bronchitis, emphysema, heart disease, hypertension, strokes, low birth weight, pre-term delivery, pre-eclampsia and (through heavy metal exposure in the womb) impaired brain function.

    Three hundred micrograms of fine particulates per cubic metre of air is classed as severe pollution, the point at which children and elderly people should not leave their homes. As Greenpeace points out, in Shanghai a fortnight ago and in Harbin in October concentrations of particulates exceeded 500 micrograms. By far the greatest source of these particles is coal burning. In total, air pollution in northern China – according to a study published in Proceedings of the National Academy of Sciences – has cut average life expectancy by five and a half years.

    We have exported much of our pollution – and its associated deaths – but the residue in our own countries is still severe. A study by the Clean Air Task Force suggests that coal power in the US causes 13,200 premature deaths a year. In Europe, according to the Health and Environment Alliance, the figure is 18,200. A study cited by the alliance suggests that around 200,000 children born in Europe each year have been exposed to “critical levels” of methylmercury in the womb. It estimates the health costs inflicted by coal burning at between €15bn (£12.5bn) and €42bn a year. Do you still reckon coal is cheap?

    You’re picturing filthy plants in Poland and Romania, aren’t you? But among the most polluting power stations in Europe, Longannet in Scotland is ranked 11th; and Drax, in England, is ranked seventh. Last week the House of Lords failed to pass an amendment that would have forced a gradual shutdown of our coal-burning power plants: they remain exempted from the emissions standards that other power stations have to meet.

    While nuclear power is faltering, coal is booming. Almost 1,200 new plants are being developed worldwide: many will use coal exported from the US and from Australia. The exports are now a massive source of income for these supposedly greening economies. By 2030 China is expected to be importing almost five times as much coal as it does today. The International Energy Agency estimates that the global use of coal will increase by 65% by 2035. Even before you consider climate change, this is a disaster.

    You don’t have to be an enthusiast for atomic energy to see that it scarcely features as a health risk beside its rival. I wonder whether the nuclear panic might be a way of not seeing. Displacement is something we all do: fixing on something small to avoid engaging with something big. Coal, on which industrialism was built – and which over the past 200 years has come to seem central to our identity – is an industry much bigger and nastier and more embedded than the one we have chosen to fear. I don’t believe our choice is accidental.

    • Twitter: @georgemonbiot. A fully referenced version of this article can be f

  • ‘Whole world’ at risk from simultaneous droughts, famines, epidemics: scientists

    ‘Whole world’ at risk from simultaneous droughts, famines, epidemics: scientists

    Research published by US National Academy of Sciences warns climate change impacts could be worse than thought
    Corn crops in New Florence, Missouri, wither in the devastating drought of 2012.

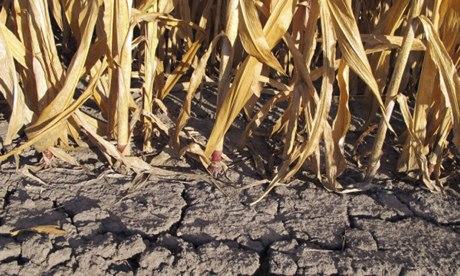
    Corn crops in New Florence, Missouri, wither in the devastating drought of 2012. Photograph: MCT via Getty Images

    An international scientific research project known as the Inter-Sectoral Impact Model Intercomparison Project (ISI-MIP), run by 30 teams from 12 countries, has attempted to understand the severity and scale of global impacts of climate change. The project compares model projections on water scarcity, crop yields, disease, floods among other issues to see how they could interact.

    The series of papers published by the Proceedings for the National Academy of Sciences (PNAS) shows that policymakers might be underestimating the social and economic consequences of climate change due to insufficient attention on how different climate risks are interconnected.

    Europe, North America at risk

    One paper whose lead author is Franziska Piontek of the Potsdam Institute for Climate Impact Research explores impacts related to “water, agriculture, ecosystems, and malaria at different levels of global warming.” The study concludes that:

    “… uncertainty arising from the impact models is considerable, and larger than that from the climate models. In a low probability-high impact worst-case assessment, almost the whole inhabited world is at risk for multisectoral pressures.”

    The uncertainties in the model are large enough that they may “mask” the risk of a “worst case” scenario of “multisectoral hotspots,” where impacts affecting “water, agriculture, ecosystems, and health” overlap in ways that could affect “all the world’s inhabited areas.”

    In the worst-case analysis, “Almost the entire global population is exposed to multisectoral pressure” at global mean temperatures of around 4C higher, with “roughly 18% of the global population” projected to “experience severe pressure in all four sectors. The affected regions are in Europe, North America, and south-east Asia.”

    How likely is this scenario? The study points out that:

    “This worst case is rather extreme, but nonetheless it represents the upper end of the risk spectrum in light of the large uncertainties.”

    Robust policy decisions to aid mitigation and adaptation strategies therefore require further research to understand “how impacts in different sectors overlap, as overlapping impacts increase exposure, lead to interactions of impacts, and are likely to raise adaptation pressure.”

    Chronic water scarcity

    Other papers point to significant risks that are much more likely on a business-as-usual emissions trajectory.

    A study led by Jacob Schewe of Potsdam finds that “the combination of unmitigated climate change and further population growth will expose a significant fraction of the world population” – potentially as much as “100%” – to “chronic or absolute water scarcity.”

    About 2.7C above preindustrial temperatures:

    “… will confront an additional approximate 15% of the global population with a severe decrease in water resources and will increase the number of people living under absolute water scarcity (<500m3 per capita per year) by another 40% (according to some models, more than 100%) compared with the effect of population growth alone.”

    The Mediterranean, the Middle East, the southern United States and southern China, for example, could see a “pronounced decrease of available water,” while southern India, western China, and parts of eastern Africa could see an increase.

    The study results represent the multiple-model average of 11 hydrological models produced by five different climate models. While some areas like southern India, western China and eastern Africa could see an increase of available water, others like the Mediterranean, the Middle East, the southern United States and southern China, would see a “pronounced decrease of available water” without curbs in greenhouse gas emissions.

    Agricultural collapse

    Water scarcity in turn will have a dramatic impact on agriculture. Another study in the PNAS collection combining climate, agricultural and hydrological models warns that freshwater shortages could double climate change’s debilitation of global food crop yields.

    Current agricultural models estimate that climate change will directly reduce food production from maize, soybeans, wheat and rice by as much as 43 percent by the end of the 21st century, encompassing a loss of between 400 and 2600 petacalories of food supply. But incorporating hydrological models reveals that when accounting for the decline of freshwater availability, there would be an additional loss of 600 to 2900 petacalories – potentially wiping out quantities equivalent to the total present-day food supply.

    Such devastating potential losses could, however, be ameliorated by more efficient use of available surplus freshwater. The paper recommends “increases in irrigation capacity and efficiency” to be complemented by “efforts to increase water use efficiency and soil conservation in rainfed systems as well, which have a demonstrated capacity to boost crop yields without further exploiting freshwater resources in rivers and aquifers.”

    Other findings of the range of studies show that increases in river flooding are expected in more than half of the areas investigated, and that the frequency of drought may increase by more than 20% in some regions.

    Potsdam director Prof Hans Joachim Schellnhuber, who co-authored several papers in the PNAS special feature, said:

    “There is an elephant in the room: current and future climate change impacts. But strangely, many people seem to be blind to it. Many decision makers prefer to turn a blind eye to global warming consequences, while many scientists tend to focus on very specific aspects of climate change. So we resemble the fabled blind men, who unknowingly touch different parts of the same elephant: grasping the animal’s trunk, one of the men is convinced he has a snake in his hand, whilst one other mistakes the tail for a rope. To recognize the animal, they must talk to each other to properly identify the individual parts and to bring them together. This is exactly what this international project does.”

  • Global Map Predicts Locations for Giant Earthquakes

    Science News

    … from universities, journals, and other research organizations

    Global Map Predicts Locations for Giant Earthquakes

    Dec. 12, 2013 — A team of international researchers, led by Monash University’s Associate Professor Wouter Schellart, have developed a new global map of subduction zones, illustrating which ones are predicted to be capable of generating giant earthquakes and which ones are not.


    Share This:

    The new research, published in the journal Physics of the Earth and Planetary Interiors, comes nine years after the giant earthquake and tsunami in Sumatra in December 2004, which devastated the region and many other areas surrounding the Indian Ocean, and killed more than 200,000 people.

    Since then two other giant earthquakes have occurred at subduction zones, one in Chile in February 2010 and one in Japan in March 2011, which both caused massive destruction, killed many thousands of people and resulted in billions of dollars of damage.

    Most earthquakes occur at the boundaries between tectonic plates that cover the Earth’s surface. The largest earthquakes on Earth only occur at subduction zones, plate boundaries where one plate sinks (subducts) below the other into the Earth’s interior. So far, seismologists have recorded giant earthquakes for only a limited number of subduction zone segments. But accurate seismological records go back to only ~1900, and the recurrence time of giant earthquakes can be many hundreds of years.

    “The main question is, are all subduction segments capable of generating giant earthquakes, or only some of them? And if only a limited number of them, then how can we identify these,” Dr Schellart said.

    Dr Schellart, of the School of Geosciences, and Professor Nick Rawlinson from the University of Aberdeen in Scotland used earthquake data going back to 1900 and data from subduction zones to map the main characteristics of all active subduction zones on Earth. They investigated if those subduction segments that have experienced a giant earthquake share commonalities in their physical, geometrical and geological properties.

    They found that the main indicators include the style of deformation in the plate overlying the subduction zone, the level of stress at the subduction zone, the dip angle of the subduction zone, as well as the curvature of the subduction zone plate boundary and the rate at which it moves.

    Through these findings Dr Schellart has identified several subduction zone regions capable of generating giant earthquakes, including the Lesser Antilles, Mexico-Central America, Greece, the Makran, Sunda, North Sulawesi and Hikurangi.

    “For the Australian region subduction zones of particular significance are the Sunda subduction zone, running from the Andaman Islands along Sumatra and Java to Sumba, and the Hikurangi subduction segment offshore the east coast of the North Island of New Zealand. Our research predicts that these zones are capable of producing giant earthquakes,” Dr Schellart said.

    “Our work also predicts that several other subduction segments that surround eastern Australia (New Britain, San Cristobal, New Hebrides, Tonga, Puysegur), are not capable of producing giant earthquakes.”


  • Australia’s fastest growing age group is 65 and over, ABS figures show

    Australia’s fastest growing age group is 65 and over, ABS figures show

    Posted 6 hours 51 minutes ago

    People aged 65 and over constitute Australia’s fastest growing age group, according to figures released by the Australian Bureau of Statistics (ABS).

    The growth rate for the group was 3.7 per cent over the past year, compared with 1.4 per cent for the working age population and 1.7 per cent for children, the figures show.

    The number of people aged 65 and over has increased from 11.6 per cent of the population (or 2.1 million people) in 1993 to 14.4 per cent (or 3.3 million people) in 2013.

    “There’s now a noticeable difference between the growth rate of the working age population – traditionally considered to be people aged 15 to 64 – and the older age groups, as more baby boomers turn 65,” said Bjorn Jarvis from the ABS.

    “The baby boomer generation is a large group of people, and the older age group will continue to grow in size as the boomers progressively reach 65.”

    Mr Jarvis says Australia’s median age has crept up over the last 20 years.

    In 1993, the “average Aussie” was about 33 years old, whereas “today that average Aussie should be starting to worry about grey hairs, as they would be around 37”.

    Tasmania recorded the biggest percentage increase in the 65-and-over age group, with the number increasing from 12.2 per cent (or 58,000 people) in 1993 to 17.3 per cent (or 89,000 people) in 2013.

    In 2013, Tasmania remained the nation’s oldest state, recording a median age of 41.2 years compared with a median age of 31.7 in the Northern Territory, making it Australia’s youngest state.

    A land of immigrants again?

    Net overseas migration accounted for 60 per cent of Australia’s population increase over the past year, adding 244,400 people to a total of 23.1 million for the year ending June 2013.

    The remaining 40 per cent, or 162,700 people, was added through “natural” means (births minus deaths).

    There were 311,400 births in the year ending June 2013, which is 1.8 per cent higher than the previous year. The same period saw 148,800 deaths, which is 1.1 per cent higher than the previous year.

    The overall growth rate was 1.8 per cent.

    Western Australia continues to have the fastest population growth in the country, with an increase of 81,000 people or 3.3 per cent growth, taking its population to more than 2.5 million people.

    New South Wales and Victoria have also experienced strong growth, both recording their largest annual increases in almost four years, increasing by 102,000 people and 106,000 people respectively.

    Topics: population-and-demographics, aged-care, work, children, immigration, australia

  • West Antarctic Ice Sheet Decline Faster Than Thought

    Site » News stories

    News

    West Antarctic Ice Sheet Decline Faster Than Thought

    17.12.2013

    17.12.2013 08:44 Age: 24 hrs

    Satellite observations show that the volume of the West Antarctic ice sheet, which may be related to climate change, is declining faster than previously thought and is contributing to global sea level rise.

    Click to enlarge. Thinning ice on the West Antarctic ice sheet. Courtesy: ESA.


    Three years of observations by ESA’s CryoSat satellite show that the West Antarctic Ice Sheet is losing over 150 cubic kilometres of ice each year – considerably more than when last surveyed.

    The imbalance in West Antarctica continues to be dominated by ice losses from glaciers flowing into the Amundsen Sea.

    “We find that ice thinning continues to be most pronounced along fast-flowing ice streams of this sector and their tributaries, with thinning rates of between 4–8 m per year near to the grounding lines – where the ice streams lift up off the land and begin to float out over the ocean – of the Pine Island, Thwaites and Smith Glaciers,” said Dr Malcolm McMillan from the University of Leeds, UK.

    Melting of ice sheets that blanket Antarctica and Greenland is a major contributor to global sea-level rise.

    Radar

    An international team of polar scientists had recently concluded that West Antarctica caused global sea levels to rise by 0.28 mm each year between 2005 and 2010, based on observations from 10 different satellite missions. But the latest research from CryoSat suggests that the sea level contribution from this area is now 15% higher.

    Launched in 2010, CryoSat carries a radar altimeter that can ‘see’ through clouds and in the dark, providing continuous measurements over areas like Antarctica that are prone to bad weather and long periods of darkness.

    The radar can measure the surface height variation of ice in high resolution, allowing scientists to calculate its volume accurately.

    Survey new regions

    Professor Andrew Shepherd from the University of Leeds, who led the West Antarctica study, said that part of the increase of ice loss could be due to faster thinning, but that part of it may also be down to CryoSat’s capacity to observe previously unseen terrain.

    “Thanks to its novel instrument design and to its near-polar orbit, CryoSat allows us to survey coastal and high-latitude regions of Antarctica that were beyond the capability of previous altimeter missions, and it seems that these regions are crucial for determining the overall imbalance,” he said.

    The findings from a team of UK researchers at the Natural Environment Research Council’s Centre for Polar Observation and Modelling were presented last week at the American Geophysical Union’s autumn meeting in San Francisco, California.

    The meeting brings together more than 20 000 Earth and space scientists, educators and students to showcase their research. ESA is also presenting the latest scientific results from its Earth observation missions.

    CryoSat has been providing a unique capacity to extend the record of Antarctic altimeter observations, following on from the 20-year record acquired by altimeters on the ERS-1, ERS-2 and Envisat satellites.

    Satellites being developed for Europe’s Copernicus programme will continue to monitor changes in the polar ice sheets during the coming decades with radar sensors on the Sentinel-1 and Sentinel-3 satellite series, scheduled to be launched from 2014 onwards.

    Source

    This story is based on a news release issued by ESA here.