|
Why this ad?
![]() Evolved Solar Specials – evolvedelectrical.com.au – Trina Solar & italian Aurora solar Systems. 3kW fr $3499, 5kW fr $5499
|
Population and Sustainability
|
Inbox
|
x |
|
4:57 PM (3 minutes ago)
![]() |
![]() ![]() |
||
|
||||
|
Why this ad?
![]() Evolved Solar Specials – evolvedelectrical.com.au – Trina Solar & italian Aurora solar Systems. 3kW fr $3499, 5kW fr $5499
|
|
Inbox
|
x |
|
4:57 PM (3 minutes ago)
![]() |
![]() ![]() |
||
|
||||
|
Why this ad?
![]() Master’s in Project Mgmt – tua.edu.au/Project_Management – Online Degree With an Emphasis on Global Projects. Enrol Today!
|
|
Inbox
|
x |
|
2:26 PM (27 minutes ago)
![]() |
![]() ![]() |
||
|
||||
|
|
|
Likely by-election date
With the vacancy arising barely five weeks before Christmas, it is not possible to have a by-election this year. Generally it is considered to be undesirable to hold a by-election during the summer holidays, so the by-election will likely take place in February or March 2014.
Cause of by-election
Former Prime Minister Kevin Rudd announced his resignation from Parliament and retirement from politics on Wednesday 13 November 2013, after losing power at the September 2013 federal election.
Read the profile for the seat of Griffith at the 2013 federal election.
Margin – ALP 3.0%
Geography
Southern Brisbane. Griffith covers the suburbs of Brisbane on the south side of the Brisbane river across the river from the Brisbane CBD, including South Brisbane itself, as well as Greenslopes, Holland Park, Kangaroo Point, East Brisbane, Coorparoo, Carina, Seven Hills, Morningside, Balmoral and Bulimba.
History
Griffith was created for the 1934 election, replacing the original seat of Oxley which was abolished at that election. Both Oxley and Griffith have been marginal seats, with Griffith swinging back and forth regularly between the Liberal Party and the ALP since 1949, although this has not usually coincided with national changes. The seat has become relatively safe for the ALP since it was won by Kevin Rudd in 1998.
The seat was first won in 1934 by Labor MP Francis Baker, who had previously won the seat of Oxley off the United Australia Party, ironically at an election when the UAP swept away the federal Labor government.
Baker was re-elected in 1937, but was killed in a car accident in 1939 at the age of 36. Ironically his father was elected to federal parliament in Maranoa in 1940, after his son’s term in Parliament.
The 1939 Griffith by-election was won by Labor candidate William Conelan. Conelan held the seat until he lost Griffith to Liberal candidate Douglas Berry in 1949.
Berry was re-elected in 1951 but lost to the ALP’s Wilfred Coutts. Coutts held on in 1955 but failed to win re-election in 1958, losing to the Liberal Party’s Arthur Chresby, and winning it back in 1961.
Coutts lost the seat once again in 1966, when the seat was won by Liberal candidate Donald Cameron. Cameron held the seat for eleven years, moving to the new seat of Fadden in 1977. He held Fadden until his defeat in 1983, and returned to Parliament at the 1983 Moreton by-election, which he held until his retirement in 1990.
The ALP regained Griffith in 1977, with Ben Humphreys winning the seat. Humphreys served as a minister in the Hawke/Keating government from 1987 until 1993, and retired at the 1996 election.
The ALP preselected Kevin Rudd, but he lost to Graeme McDougall (LIB). McDougall only held on for one term, losing to Rudd in 1998. Rudd joined the ALP shadow ministry in 2001 as Shadow Minister for Foreign Affairs, a role he held for five years.
Rudd’s profile rose as Shadow Foreign Minister, and he was considered a contender for the ALP leadership when Simon Crean resigned in 2003 and when Mark Latham resigned in 2005, but he waited until late 2006 when he challenged Kim Beazley, and was elected leader, and then proceeded to win the 2007 federal election, becoming Prime Minister.
Kevin Rudd was removed as Labor leader and Prime Minister in June 2010, and was re-elected in Griffith as a Labor backbencher. He returned to the ministry as Foreign Minister following the election. He returned to the backbench as part of a failed challenge to Julia Gillard’s leadership in February 2012.
Kevin Rudd defeated Julia Gillard to regain the Labor leadership in June 2013, and led the ALP to defeat at the 2013 federal election.
Candidates
Possible Labor candidates include local state MP Di Farmer, local councillor Shayne Sutton and lawyer Terri Butler. The Liberal National Party is expected to run former AMA President Bill Glasson, who ran for the seat in 2013. The Greens are again running 2013 candidate Geoff Ebbs.
Assessment
Governments, even new governments, don’t usually gain seats off an opposition.
Kevin Rudd has always had a strong personal vote, and the loss of that vote could see Glasson gain even more ground in an area where he has a very high profile.
It is quite easy to see a scenario where Labor loses, but the LNP may not perform as strongly in its new position in government.
2013 result
| Candidate | Party | Votes | % | Swing |
| Kevin Rudd | ALP | 36,481 | 42.22 | +6.42 |
| Bill Glasson | LNP | 34,878 | 40.36 | -3.72 |
| Geoff Ebbs | GRN | 8,799 | 10.18 | -5.21 |
| Karin Hunter | PUP | 2,903 | 3.36 | +3.36 |
| Greg Sowden | IND | 705 | 0.82 | +0.82 |
| Adam Kertesz | FF | 643 | 0.74 | -0.71 |
| Luke Murray | KAP | 595 | 0.69 | +0.69 |
| Anne Reid | SEC | 445 | 0.51 | +0.51 |
| Sherrilyn Church | RUA | 418 | 0.48 | +0.48 |
| Liam Flenady | SA | 377 | 0.44 | +0.44 |
| Jan McNicol | SPP | 165 | 0.19 | +0.19 |
2013 two-candidate-preferred result
| Candidate | Party | Votes | % | Swing |
| Kevin Rudd | ALP | 45,805 | 53.01 | -5.45 |
| Bill Glasson | LNP | 40,604 | 46.99 | +5.45 |
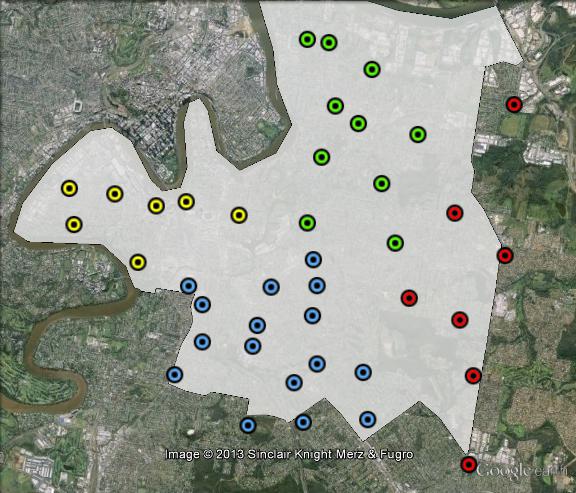
Polling places in Griffith at the 2013 federal election. Bulimba in green, East in red, Greenslopes in blue, South Brisbane in yellow. Click to enlarge.
Booth breakdown
Booths have been divided into four areas. Bulimba in the north, Greenslopes in the south, South Brisbane in the west and a series of booths along the eastern boundary.
The ALP won a majority in three areas, ranging from 54% in the east to just under 60% in South Brisbane. The LNP won a slim majority in Bulimba. The ALP suffered a swing in all four areas, ranging from 2.6% in South Brisbane to 6.6% in Bulimba.
The Greens vote varies widely, from 6% in the east and 7% in Bulimba up to almost 17% in South Brisbane.
| Voter group | GRN % | ALP 2PP % | ALP swing | Total votes | % of votes |
| Bulimba | 7.10 | 49.42 | -6.63 | 19,116 | 22.12 |
| Greenslopes | 10.15 | 54.85 | -3.67 | 18,880 | 21.85 |
| South Brisbane | 16.93 | 59.74 | -2.62 | 12,686 | 14.68 |
| East | 6.21 | 54.07 | -4.28 | 7,772 | 8.99 |
| Other votes | 10.35 | 50.87 | -7.45 | 27,955 | 32.35 |

Two-party-preferred votes in Griffith at the 2013 federal election.

Ocean acidification may increase 170% this century with substantial costs expect…
Over the past two decades, researchers have shown that ocean acidification is in…
UN Secretary-General Ban Ki-moon has announced his first Scientific Advisory Boa…
Several communities that study the Earth’s land do not yet speak the same langua…
Large urban agglomerations inevitably lead to air pollution. But despite the significant impacts on human health and climate, we lack systematic measurements of air pollution in many cities. Megan L Melamed, Tong Zhu and Liisa Jalkanen discuss a new global assessment that illuminates the knowns and unknowns.
Rising sea levels will eventually threaten many coastal cities. But a dominant focus on the long-term endgame should not unduly restrict our options to deal with the more immediate consequences of climate change, says Richard Little .
Videos now online from the Stockholm public forum to mark the launch of the IPCC’s climate report, 2…
Livestream begins 13:00, Saturday 28 September
A new data visualization, produced by IGBP and Globaia, charts how the global water cycle is changing…
This summary for policymakers reports on the state of scientific knowledge on ocean acidification, based on the latest research presented at The Third Symposium on the Ocean in a High-CO2 World, held in Monterey, California, in September 2012. Experts present the projected changes from ocean acidification for ecosystems and the people who rely on them, according to levels of confidence for these outcomes.
Ocean Acidification Summary for Policymakers
Third Symposium on the Ocean in a High-CO2 World
A3 size high resolution jpg of pH infographic (4.7mb)
A3 size high resolution jpg of Aragonite infographic (4.4mb)
Download the summary here, as well as the infographics that illustrate the problems that ecosystems and humans face as ocean acidification increases over the next century. The summary addresses outcomes based on whether humans continue to emit carbon dioxide at current rates to the atmosphere, or what could happen if policymakers take action to mitigate these emissions.

Ocean pH in 2100
The average pH of ocean surface waters has fallen by about 0.1 units, from 8.2 to 8.1, since the beginning of the industrial revolution. This corresponds to a 26% increase in acidity. Please see original infographic for sources and further information.
Ocean pH in 1850
Compared with preindustrial levels shown here, the projected increase in ocean acidity is about 170% by 2100 if high CO2 emissions continue (RCP* 8.5).
Atmospheric CO2 and ocean pH
Observations of CO2 (parts per million) in the atmosphere and pH of surface seawater from Mauna Loa and Hawaii Ocean Time-series (HOT) Station Aloha, Hawaii, North Pacific.
Credit: Adapted from Richard Feely (NOAA), Pieter Tans, NOAA/ESRL (www.esrl.noaa.gov/gmd/ccgg/trends) and Ralph Keeling, Scripps Institution of Oceanography (scrippsco2.ucsd.edu)
Observed CO2 emissions and emissions scenarios to 2100
Global CO2 emissions (white dots, uncertainty in grey) from fossil fuel use is following the high emissions trajectory (red line, RCP* 8.5) predicted to lead to a significantly warmer world. Large and sustained emissions reductions (blue line, RCP* 2.6) are required to increase the likelihood of remaining within the internationally agreed policy target of 2°C.
Credit: Glen Peters and Robbie Andrew (CICERO) and the Global Carbon Project, adapted from Peters et al., 2013 (reference 8). Historic data from Carbon Dioxide Information Analysis Center.
Ocean surface pH projections to 2100
Modelled global sea-surface pH from 1870 to 2100. The blue line reflects estimated pH change resulting from very low CO2 emissions to the atmosphere (IPCC Representative Concentration Pathway, RCP* 2.6). The red line reflects pH from high CO2 emissions (the current emissions trajectory, RCP* 8.5).
Credit: Adapted from Bopp et al., 2013 (reference 9).
Aragonite saturation in 2100
This map shows the “saturation state” for the mineral form of calcium carbonate called aragonite.
If Ω is less than 1 (Ω<1), conditions are corrosive (undersaturated) for aragonite-based shells and skeletons. Coral growth benefits from Ω≥3.
By 2100, computer model projections show that Ω will be less than 3 in surface waters around tropical reefs if CO2 emissions continue on the current trajectory.
This issue’s cover story puts 2000 years of regional temperature histories into perspective. Also featured: two full-spread maps visualising the PAGES 2k regional temperature records and ocean acidifi…
The cover story in this issue explores the phenomenon of land grabs by taking a closer look at the Southeast Asian nation of Laos. Also featured are articles on resilience in the face of sea-level…
UN panel foresees big growth in renewable energy, but policies will dictate just how big.
Royal Society, Philosphical Transactions A
New USGS Study on Chesapeake Bay: Groundwater Delaying the Effects of Some Water Quality Actions
Released: 11/12/2013 9:00:00 AM
| Contact Information: U.S. Department of the Interior, U.S. Geological Survey Office of Communications and Publishing 12201 Sunrise Valley Dr, MS 119 Reston, VA 20192 |
Jon Campbell Phone: 703-648-4180 Ward Sanford |
| New research by the U.S. Geological Survey conducted on the Delmarva Peninsula, which forms the Eastern Shore of the Chesapeake Bay, indicates it may take several decades for many water-quality management practices aimed at reducing nitrogen input to the Bay to achieve their full benefit due to the influence of groundwater.
The USGS findings provide critical information on how long it may take to see the water quality in the Bay improve as more stringent practices are implemented to reduce nutrients and sediment to tidal waters. Having established a calculation for the total nitrogen, phosphorus, and sediment pollutants that are allowable for the Chesapeake watershed, known as the total maximum daily load (TMDL), the U.S. Environmental Protection Agency (EPA) is working with Maryland, Pennsylvania, Virginia and the four other Bay watershed jurisdictions to ensure that all water-quality practices needed to reduce the flow of nutrients and sediment to the Bay are in place by 2025. “This new understanding of how groundwater affects water-quality restoration in the Chesapeake Bay will help sharpen our focus as many agencies, organizations, and individuals work together to improve conditions for fish and wildlife,” said Lori Caramanian, Department of the Interior Deputy Assistant Secretary for Water and Science. “In turn, improved environmental conditions will serve to further people’s enjoyment and promote the economic benefits of the Nation’s largest estuary.” The responses of watershed systems and ecosystems to environmental management actions at any location can vary from rapid changes (such as the swift beneficial effect of a wastewater treatment plant upgrade) to longer improvement intervals of several decades. In the Chesapeake Bay, “lag response time” refers to the time between implementing management actions and the resulting improvements in water quality. Lag times will vary for nitrogen, phosphorus, and sediment. This USGS study focused on nitrogen. Some of the nitrogen will run off directly into a stream, but a large portion on the Delmarva (more than two thirds) is affected by the slow travel times of nutrients moving from their land source through underground aquifers to a receiving stream or estuary. Sources of nitrogen include fertilizer and manure applications to agricultural land, wastewater and industrial discharges, runoff from urban areas, domestic septic drain fields, and air emissions. Excess nitrogen contributes to algal blooms that cause low dissolved oxygen in the Bay and related fish kills each summer and impact recreational activities. For this study USGS scientist Ward Sanford developed a complex model for water, geology, and chemical interactions that he applied to seven separate watersheds on the Delmarva Peninsula. Based on the concept of nitrogen mass-balance regression, the model was able to reproduce the time history of nitrate concentrations in area streams and wells, including a recent slowdown in the rate of concentration increase in streams. The model was then also used to forecast future nitrogen delivery from the Delmarva Peninsula to the Bay under different nitrogen management scenarios. The new study shows that ages of groundwater and associated nitrogen from the Delmarva Peninsula into the Chesapeake Bay range from less than a year to centuries, with median ages ranging from 20 to 40 years. These groundwater age distributions are markedly older than previously estimated for areas west and north of the Bay, which has a median age of 10 years. The older ages occur because the porous, sandy aquifers on the Delmarva yield longer groundwater return times than the fractured-rock areas of the Bay watershed. The USGS research found that in some areas of the Delmarva the groundwater currently discharging to streams is gradually transitioning to waters containing higher amounts of nitrate due to fertilizer used during the 1970s through the 1990s. Similarly, the total amount of nitrogen in the groundwater is continuing to rise as a result of the slow groundwater response times. Without additional management practices being implemented, the study forecasts about a 12% increase in nitrogen loads from the Delmarva to the Bay by 2050. The study provides several scenarios for reducing nitrogen to the water table and the amount of time needed to see the reductions in groundwater discharging to streams. For example, the model predicts that a 25% reduction in the nitrogen load to the water table will be required to have a 13% reduction in load to the bay. However, the results also indicate that nutrient management practices implemented over the past decade or so have begun to work and confirm that the amount of the nitrogen loading to streams in the future will depend on the rigor of water-quality practices implemented to reduce nutrients at present. This study highlights the complexities of environmental restoration of the Bay. The findings help refine the expectations of resource managers and citizens alike of how long it may take to see substantial water-quality improvements in the Bay, and they may provide additional insight into the effectiveness of different types of land management practices given the time lag created by local groundwater response times. The study was done as part of increased federal efforts under the President’s 2009 Chesapeake Executive Order, which directs Federal agencies, including the EPA and the Department of the Interior, to “begin a new era” in protection and restoration of the Chesapeake Bay. With a watershed that spreads across six states and Washington, DC, the Chesapeake Bay is the largest estuary in the United States and one of the largest and most biologically productive estuaries in the world. Learn more “Quantifying Groundwater’s Role in Delaying Improvements to Chesapeake Bay Water Quality,” Environmental Science & Technology |
USGS provides science for a changing world. Visit USGS.gov, and follow us on Twitter @USGS and our other social media channels.
Subscribe to our news releases via e-mail, RSS or Twitter.
Links and contacts within this release are valid at the time of publication.
In the wake of the horror of Haiyan’s devastation, the Philippines government is desperately calling on the world to act urgently to help them now* AND curb the next climate catastrophe. But shockingly three countries are blocking their heart wrenching appeal.
Haiyan is a byproduct of climate change. Human pollution makes our planet hotter, the storms get more fierce, and the world’s poorest communities often suffer most. Right now a deal is being discussed to cut pollution and help finance vulnerable countries to meet this crisis. But three governments are obstructing negotiations and outrageously proposing to increase pollution: Australia, Japan, and Poland.
Haiyan has built media and political pressure at the climate summit taking place right now. The Philippines’ delegate said ‘What my country is going through as a result of this extreme climate event is madness. The climate crisis is madness. We can stop this madness.’ Let’s build a million strong petition to back his call for urgent action. Sign now — let’s make sure these three countries put lives over polluters profits:
http://www.avaaz.org/en/philippines_vs_polluters_1/?bBYMjdb&v=31036
Haiyan is the latest in an alarming trend of freak weather events being driven by climate change. These events hit the poorest hardest because their communities are not set up to withstand them. But their scope is increasing and now richer countries like the US, Australia and some in the EU are feeling the brunt of a new climate reality.
Tragically it has taken these disasters to kick life back into a stalling UN process to agree a climate deal. Governments have now agreed that 2015 is our last chance to get an agreement that can save our planet from a maelstrom of superstorms and disaster. The meeting this week in Warsaw is the most important global meeting this year to lay the groundwork for a deal. But Japan and Australia want to backtrack on their commitments to cut emissions, and Poland is blocking Europe’s ambitions.
If, even in the wake of Haiyan, these countries do the opposite of what the world needs — our chances of success are grim. We’re in a 2 year race to save the world. Haiyan has given us a powerful reminder of what’s at stake. Let’s get behind the Philipines and stop the madness of Australia, Japan and Poland. Sign the petition now:
http://www.avaaz.org/en/philippines_vs_polluters_1/?bBYMjdb&v=31036
With more than 29 million members around the world — Avaaz is in a unique position to get behind the Filipino government and deliver a strong wake-up call to the negotiators in Warsaw. Together, we have influenced international summits, world leaders and our parliaments to get firm action on climate change — now out of the tragedy of Haiyan let’s demand countries start doing more.
With hope,
Iain, Alice, Pascal, Luis, Caroline and the entire Avaaz team
PS: There are many ways to support the relief efforts for the victims of Cyclone Haiyan. Check out 350.org’s list of organisations: http://stories.350.org/donate-to-help-victims-of-typhoon-haiyan/?akid=3777.109376.nH0GMi&rd=1&t=1
Sources:
In hard-hit Tacloban, children ripped from arms (CNN)
http://edition.cnn.com/2013/11/09/world/asia/philippines-tacloban/index.html
Typhoon Haiyan: what really alarms Filipinos is the rich world ignoring climate change (The Guardian)
http://www.theguardian.com/commentisfree/2013/nov/08/typhoon-haiyan-rich-ignore-climate-change
Typhoon Haiyan influenced by climate change, scientists say (Sydney Morning Herald)
http://www.smh.com.au/environment/climate-change/typhoon-haiyan-influenced-by-climate-change-scientists-say-20131111-2xb35.html
Typhoon Haiyan: Philippines destruction ‘absolute bedlam’ (BBC)
http://www.bbc.co.uk/news/world-asia-24894529
Deadly Typhoon Haiyan Devastates the Philippines, Heads for Vietnam (TIME)
http://world.time.com/2013/11/10/deadly-typhoon-haiyan-devastates-the-philippines-heads-for-vietnam/

Avaaz.org is a 28-million-person global campaign network that works to ensure that the views and values of the world’s people shape global decision-making. (“Avaaz” means “voice” or “song” in many languages.) Avaaz members live in every nation of the world; our team is spread across 18 countries on 6 continents and operates in 17 languages. Learn about some of Avaaz’s biggest campaigns here, or follow us on Facebook or Twitter.
You are getting this message because you signed “Join Avaaz!” on 2012-06-22 using the email address ngarthurslea@yahoo.com.au.
To ensure that Avaaz messages reach your inbox, please add avaaz@avaaz.org to your address book. To change your email address, language settings, or other personal information, contact us, or simply go here to unsubscribe.
To contact Avaaz, please do not reply to this email. Instead, write to us at www.avaaz.org/en/contact or call us at +1-888-922-8229 (US).