The IPCC report: busting the climate myths
Updated Mon 30 Sep 2013, 7:02am AEST
The release of the IPCC Fifth Assessment Report provides details that stamp out the myths and distortions of those trying to discredit climate science. Has the Earth stopped warming over the past 15 years? The answer is an emphatic no, writes Will Steffen.
The highly anticipated IPCC Fifth Assessment Report has generated much media interest. A good deal of this, however, has consisted of earlier media reports and articles that broke the embargo on the release of any information from the draft IPCC report.
Such media efforts, based on leaked versions of the IPCC draft, were often aimed at distorting, misrepresenting or undermining the IPCC’s assessment. This type of media coverage frequently states or infers that the warming of the Earth has stopped and thus action on climate change can be slowed or de-prioritised.
This isn’t the first time we’ve seen such behaviour. The appearance of the “Climategate” hacked emails in advance of the 2009 Copenhagen climate conference was designed to discredit the mainstream climate science community and hijack the narrative on climate science. So seeding doubt and promulgating misleading science is nothing new.
Now that the IPCC report has been finalised and released, we can analyse, based on the actual substance of the report, these earlier myths and misleading claims.
So has the Earth stopped warming over the past 15 years? The answer, based on the reputable science contained in the IPCC report, is an emphatic NO!
Here are the facts:
The Earth has warmed significantly over the last century, and particularly strongly since 1970 up to the present. The global average air temperature has risen by 0.89 degrees Celsius over the 1901-2012 period, and the decade 2001-2010 was the warmest on record.
But global average air temperature is only a very small part of the warming story, as the atmosphere absorbs only 3 per cent of the additional heat trapped by the increasing concentration of greenhouse gases. By far the biggest player in the climate system is the ocean.
Over 90 per cent of the warming since the mid-20th century has occurred in the ocean, and the heat content of the ocean has risen steadily since about 1970 with no pause or slowing of the rate over the past 15 years. That is really the “smoking gun” of warming. But there is even more evidence of a strongly warming Earth.
The ice cover over the Arctic Ocean is decreasing rapidly, at a rate of about 4 per cent per decade since 1979. Such rapid ice loss is unprecedented in the last 2,000 years.
Sea level has risen by 19 cm over the 1900-2010 period. This observed rate of rise over the past century is unusually high in the context of the last 2,000 years.
Glaciers and ice sheets around the world are shrinking and losing mass. The combined rate of mass loss from the large polar ice sheets on Greenland and Antarctica was about 350 billion tonnes per year for the period 2002-2011, and is accelerating.
It is even more telling that the rate of sea-level rise, the rate of decrease of Arctic sea ice extent, and the rate of mass loss from Greenland and Antarctica have all increased in the period from the 1990s to the present, compared to earlier periods. This is exactly the opposite of what one would expect if warming of the Earth is slowing or has stopped.
All of this evidence points to the continued strong warming of the Earth since the mid-20th century up to the present, in stark contrast to the erroneous reports purported to be based on leaked drafts of the IPCC assessment.
A second example of distortion and misrepresentation is the claim that, according to the IPCC, the climate is less sensitive to increases in greenhouse gas concentrations in the atmosphere than was earlier thought. The IPCC has said no such thing. Here are the facts:
The range of estimated climate sensitivity in the Fifth Assessment Report, 1.5-4.5C per doubling of atmospheric carbon dioxide concentration, is slightly larger than that reported in the 2007 report (2.0-4.5C). The 0.5C decrease in the lower end of the range reflects estimates using the records of atmosphere and ocean temperature change in the contemporary period.
Estimates of climate sensitivity using climate model simulations and observational records from past climate changes (for example, the transition of the Earth from the last ice age to the present warm period) give estimates towards the mid and upper end of the range, while methods based on contemporary observations give estimates towards the lower end of the range. The IPCC gives no estimate of a “most likely” value of climate sensitivity.
In summary, there has been no significant change in our estimate of climate sensitivity since the publication of the IPCC Fourth Assessment Report in 2007.
So much for the myths and distortions of those trying to discredit climate science. What actually are the key messages of the IPCC Fifth Assessment Report?
- There is stronger evidence that the Earth’s climate is warming – rising air and ocean temperature, loss of mass from glaciers and ice sheets, and rising sea level.
- Scientists are more certain than ever that most of the warming since 1950 has been caused by human activities, primarily the emission of carbon dioxide from fossil fuel combustion.
- A warming climate is influencing the frequency and severity of many extreme weather events and is changing rainfall patterns, creating risks for human well-being, the economy and the environment.
- Stabilising the climate system will require substantial and sustained reductions of carbon dioxide emissions, and those of other greenhouse gases.
As the Climate Commission, and now the Climate Council, often say – this is the critical decade to get on with the job of reducing emissions quickly and deeply.
Professor Will Steffen is executive director of the ANU Climate Change Institute and a member of the Australian Climate


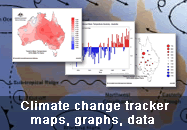
 October 2012 to September 2013 mean temperature deciles for Australia showing 12-month temperatures were the highest on record for 39% of Australia.
 Monthly mean temperature anomalies for September 2012 to September 2013.


 1.
1.