Category: Uncategorized

  • New renewable energy planning rules unveiled

    New renewable energy planning rules unveiled

    Guidance aims to help local authorities weigh up renewable energy projects against other environmental concerns

     Cheyne Court Wind Farm on Romney Marsh, Kent.

    A general view from Camber Sands in East Sussex of the Cheyne Court windfarm on Romney Marsh, Kent. Photograph: Gareth Fuller/PA

    The renewable energy industry has welcomed new planning guidance designed to help local authorities weigh up the need for renewable energy projects against other environmental concerns.

    The Department for Communities and Local Government (DCLG) today issued new planning guidance, which stressed that the need for renewable energy “does not automatically override environmental protections and the planning concerns of local communities”.

    The guidance is designed to help officials interpret the National Planning Policy Framework (NPPF), published last year, which encourages the development of renewable energy projects to meet a national target for 15 per cent of the UK’s energy to come from renewable sources by 2020.

    Announcing the new guidelines today, Communities Minister Baroness Hanham said some communities have “genuine concerns” that planning officers are failing to give enough weight to local environmental considerations like the impact on landscape, heritage sites, and “local amenity”, when considering planning applications for wind turbines or solar arrays.

    “Our new planning practice guidance will help decisions on green energy get the environmental balance right in line with the framework,” she said. “Meeting our energy goals should not be used to justify the wrong development in the wrong location.”

    The guidance was welcomed by trade association RenewableUK, which noted that the new document would not only provide greater policy certainty for developers but would also block proposed “buffer zones” around properties.

    Maf Smith, deputy chief executive of RenewableUK, said the guidance highlighted the need to balance a range of environmental concerns when planning a new development.

    “Following a long debate about onshore wind costs and benefits, we trust that this period of uncertainty for the industry is now at an end, and that we will see planning policy and guidance producing robust, objective planning decisions,” he said.

    But Friends of the Earth’s planning campaigner Naomi Luhde-Thompson slammed the government for diluting the requirement for councils to consider their responsibility for delivering renewable energy capacity when considering planning applications.

    “It’s staggering that the minister has refused to insist on councils playing their part in developing renewable energy goals – unless everyone takes urgent action, the UK will fail to meet its targets for slashing emissions,” she said.

  • FEDERAL ADVISORY COMMITTEE DRAFT CLIMATE ASSESSMENT

    FEDERAL ADVISORY COMMITTEE DRAFT CLIMATE ASSESSMENT

    The public review period is now closed; over 4,000 public comments were received and are being addressed by the authors. The National Academy review is complete and can be read here. The public review draft remains available below while the report is revised by the author teams. Thank you for your interest in the National Climate Assessment.

    A 60-person Federal Advisory Committee (The “National Climate Assessment and Development Advisory Committee” or NCADAC) has overseen the development of this draft climate report.

    The NCADAC, whose members are available here (and in the report), was established under the Department of Commerce in December 2010 and is supported through the National Oceanic and Atmospheric Administration (NOAA). It is a federal advisory committee established as per the Federal Advisory Committee Act of 1972. The Committee serves to oversee the activities of the National Climate Assessment. Its members are diverse in background, expertise, geography and sector of employment. A formal record of the committee can be found at the NOAA NCADAC website.

    The NCADAC has engaged more than 240 authors in the creation of the report. The authors are acknowledged at the beginning of the chapters they co-authored.

    Following extensive review by the National Academies of Sciences and by the public, this report will be revised by the NCADAC and, after additional review, will then be submitted to the Federal Government for consideration in the Third National Climate Assessment (NCA) Report.  For more information on the NCA process and background, previous assessments and other NCA information, please explore the NCA web-pages. The NCA is being conducted under the auspices of the Global Change Research Act of 1990 and is being organized and administered by the Global Change Research Program.

    To simply access and read the draft report, please download the chapters below. However, if you would like to submit comments on the report as part of the public process, you will need to enter the “review and comment system” and register with your name and e-mail address and agree to the terms.  All comments must be submitted through the review and comment system.

    In addition to the draft report below, you may also be interested in the following documents which provided input to the NCA:

    Download Chapters of the NCADAC Draft

    Climate Assessment Report! 

    Provide Comments on the Report!
     

    Download the Full Report* (warning, 147Mb. Very large file)

    Between chapters, there are some page numbers that are not used. This is intentional and does not reflect missing pages.


    or download each chapter separately:

    Cover page*

    Introduction: Letter to the American People

    1. Executive Summary

    2. Our Changing Climate

    Introduction to Sectors

    3. Water Resources

    4. Energy Supply and Use

    5. Transportation

    6. Agriculture

    7. Forestry

    8. Ecosystems, Biodiversity, and Ecosystem Services

    9. Human Health

    10. Water, Energy, and Land Use

    11. Urban Systems, Infrastructure, and Vulnerability

    12. Impacts of Climate Change on Tribal, Indigenous, and Native Lands and Resources

    13. Land Use and Land Cover Change

    14. Rural Communities

    15. Interactions of Climate Change and Biogeochemical Cycles

    Introduction to Regions

    16. Northeast

    17. Southeast and Caribbean

    18. Midwest

    19. Great Plains

    20. Southwest*

    21. Northwest

    22. Alaska and the Arctic

    23. Hawaii and the U.S. Affiliated Pacific Islands

    24. Oceans and Marine Resources

    25. Coastal Zone Development and Ecosystems

    Introduction to Response Strategies

    26. Decision Support: Supporting Policy, Planning, and Resource Management Decisions in a Climate Change Context

    27. Mitigation

    28. Adaptation

    29. Research Agenda for Climate Change Science

    30. The NCA Long-Term Process: Vision and Future Development

    Appendix I: NCA Climate Science – Addressing Commonly Asked Questions from A to Z

    Appendix II: The Science of Climate Change

    * These files were changed on Monday, Jan 14 to correct the color coding on Figure 20.3 in the Southwest chapter and to correct the affiliation for one of the NCADAC committee members. The correct versions of the files were available on the Review and Comment system when it went live at 9am EST, January 14.

    Between January 14th and April 12th only: Please go to the Review and Comment System to provide comments on the draft.


    You must register and accept the terms in the Review and Comment System in order to review this document. Comments will only be accepted through this system.

    NOTE: You will not be allowed to create an account in the system prior to 9am ET January 14th, 2013, and the comment period ends at 5pm ET on April 12th, 2013


    Between chapters, there are some page numbers that are not used. This is intentional and does not reflect missing pages.

  • Sequenced pPalm oil genome paves the way for sustainable plantations

    Sequenced palm oil genome paves the way for sustainable plantations

    Researchers pinpoint a gene that could be used to boost yields and reduce competition between forests and oil palms

    Palm oil View larger picture

    Researchers have just sequenced the palm oil genome. Photograph: Oliver Balch

    Few environmentalists feel any fondness for the oil palm, with its connections to deforestation in the tropics. But the waxy orange pods the tree sprouts in vivid bunches generate 45 percent of the globe’s edible oil, and consuming this incredibly versatile product is almost unavoidable, for it goes into everything from chocolate and peanut butter, to biscuits and cereal. The debate over how to turn palm oil into a sustainable crop has consequently been a priority for some time.

    Now, a duo of papers just published in Nature moves a step in that direction, suggesting that breeders could further boost oil palm yields, and in that way significantly reduce the competition between rainforests and palm oil plantations around the world.

    In one of the two papers, the research team has made a fully sequenced palm oil genome available to the public for the very first time. But it’s the second, linked, paper that has sparked the most interest with its more specific discovery of a gene, called SHELL, that gives rise to the most productive and commercially valuable kinds of oil palm fruits.

    Environmental concern motivated the research, says Rajinder Singh, an author on the paper and leader of the genomics group for the Malaysian Palm Oil Board (MPOB), the government entity that oversees the industry in Malaysia and which funded the research. “The first thing was to try and produce more oil palms with existing land,” he says. “The idea is not to encroach in new areas.”

    Singh explains that the discovery equips farmers in the tropics with the ability to identify and plant only the most productive seeds, in turn reducing the pressure to expand into virgin rainforest. “It has implications in three continents.”

    The African oil palm is the primary source of palm oil globally, and its domestication in Southeast Asia, South America, and West Africa now drives the industry. The trees produce three kinds of fruit—dura, pisifera, and tenera, the latter being the perfect hybrid of the other two, because it yields the most oil.

    These plump ochre rounds are a farmer’s gold, producing 30 percent more oil than other types. Breeders try to control the output of tenera-yielding seeds by manually cross-pollinating the most suitable dura and pisifera plants. But getting a field that teems with tenera is still a challenge, because natural pollinators intervene.

    Wind, birds, and insects can result in uncontrolled ‘contamination’—which just means that a dura plant’s pollen gets crossed with another dura for instance, and gives rise to plants that won’t produce the much sought-after tenera fruits. So while manual crossover works for the most part, “there’s an error rate associated with it that varies a lot, but it’s pretty high,’ says Robert Martienssen, a plant geneticist and author on the paper, who lectures at Cold Spring Harbor Laboratory in New York.

    Usually, farmers have to wait upwards of five years until palm oil plants bear fruiting bunches to figure out if they’re going to yield the desired tenera pods. Knowing the SHELL gene that triggers the production of these fruits, however, gives breeders a way to test things first.

    “If you screen at the nursery stage you can select what you want to field plant,” Singh explains. Screening would work much the same way as a genetic test on a human. “Immediately with our tools you can check which are the seeds of the type you want,” adds Ravigadevi Sambanthamurthi, head of the Advanced Biotechnology and Breeding Center at the MPOB.

    palm oil fruit genome 
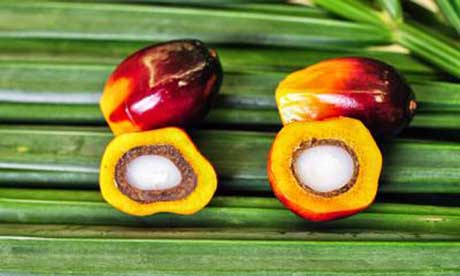
These fruits of the oil palm shows the Dura fruit on the left and the Tenera fruit on the right. Tenera fruits yield 30 percent more oil per fruit than Dura fruits. Photograph: Malaysian Palm Oil BoardThat puts years back on the clock, and gives farmers a sure way to increase production. “Now with proper quality control we might have contamination of less than ten percent,” Sambanthamurthi says. Currently, plantations in Malaysia yield four tons of oil per hectare per year. The research could go some way toward achieving the goal of six tons by 2020.

    But talk of palm oil expansion raises hackles. Many people hear the phrase and mentally switch to the iconic orangutan, and for good reason, since forest clearance for plantations in Indonesia especially has resulted in death and displacement in orangutan populations.

    Palm oil has become synonymous with illegal logging, and slash and burn tactics that leave virgin forest devastated. There are also allegations of worker abuse on plantations, and the destruction of indigenous peoples’ livelihoods.

    Viewing the entire palm oil industry as one ungoverned force, however, springs from “misinformation,” says Choo Yuen May, the director general of the MPOB. In Malaysia “more than 50 percent of the land is [still] under forest cover,” she says. The government there has held a pledge since 1992 to maintain that 50 percent, and plantations are only supposed to expand onto land that had previously been cleared for crops like cocoa or rubber.

    Plantations also generate income for thousands of workers. “It’s an avenue for poverty reduction…we cannot forget that there are people out there who are hungry,” Sambanthamurthi argues.

    And ultimately, palm oil crops only use up five percent of total land area farmed for oil crops globally—yet they produce almost half of the world’s edible oil. But when they do infringe on natural habitat, it happens to be tropical rainforest, symbolic of the globe’s diversity and a plethora of charismatic species.

    Palm oil remains contentious, yet its advance is inevitable. And mapping the genome is not going to solve the problem absolutely. “Our ultimate goal was to reduce the rainforest footprint; the damage that is done by these plantations,” says Martienssen. “But biology can only do so much. Policy has to be a big part of the equation.”

    Speaking from the World Resources Institute (WRI) in a statement via email, Nigel Sizer, the Institute’s Global Forest Initiative director, said, “Increasing the productivity of existing oil palm plantations through better plants is promising, but the real issue is that we need better protections for forests and better alternatives for producers to grow their businesses.” Future standards should require that palm oil plantations only expand onto land that is already degraded instead of into untouched forest, he went on to say.

    For Martienssen, the solution lies in tightening regulations, but also in motivating farmers with the practical solutions that this new research affords.

    In the future, governments “will be able to offer farmers, and especially small holders, seeds that have much more predictable yields. The way I think about that is that that would be a strong incentive for those farmers to obey the law,” he says. “As much as possible you want the farmer to voluntarily take up those policies.”

  • production following permafrost thaw

    Article preview View full access options

    Nature Climate Change | Letter

    • Print
    • Email
    • Share/bookmark

    Long-term CO2 production following permafrost thaw

    Nature Climate Change
    (2013)
    doi:10.1038/nclimate1955
    Received
    21 August 2012
    Accepted
    17 June 2013
    Published online
    28 July 2013

    Thawing permafrost represents a poorly understood feedback mechanism of climate change in the Arctic, but with a potential impact owing to stored carbon being mobilized1, 2, 3, 4, 5. We have quantified the long-term loss of carbon (C) from thawing permafrost in Northeast Greenland from 1996 to 2008 by combining repeated sediment sampling to assess changes in C stock and >12 years of CO2 production in incubated permafrost samples. Field observations show that the active-layer thickness has increased by >1 cm yr−1 but thawing has not resulted in a detectable decline in C stocks. Laboratory mineralization rates at 5 °C resulted in a C loss between 9 and 75%, depending on drainage, highlighting the potential of fast mobilization of permafrost C under aerobic conditions, but also that C at near-saturated conditions may remain largely immobilized over decades. This is confirmed by a three-pool C dynamics model that projects a potential C loss between 13 and 77% for 50 years of incubation at 5 °C.

    At a glance

    Figures

    First | 1-1 of 3 | Last

    left

    1. Trends in permafrost thawing and soil organic C content.
      Figure 1
    2. C loss during a 12-year-long incubation at 5[thinsp][deg]C.
      Figure 2
    3. C loss during a three-year-long incubation based on five sites
      Figure 3

    right

    Read the full article

    References

    1. Tarnocai, C. et al. Soil organic carbon pools in the northern circumpolar permafrost region. Glob. Biogeochem. Cycle 23, GB2023 (2009).
    2. Schuur, E. A. G. et al. The effect of permafrost thaw on old carbon release and net carbon exchange from tundra. Nature 459, 556–559 (2009).
    3. Schuur, E. A. G. et al. Vulnerability of permafrost carbon to climate change: Implications for the global carbon cycle. BioScience 58, 701–714 (2008).
    4. Hollesen, J., Elberling, B. & Jansson, P. E. Future active layer dynamics and CO2 production from thawing permafrost layers in Northeast Greenland. Glob. Change Biol. 17, 911–926 (2011).
    5. Elberling, B., Christiansen, H. H. & Hansen, B. U. High nitrous oxide production from thawing permafrost. Nature Geosci. 3, 332–335 (2010).
    6. Knoblauch, C. et al. Predicting long-term carbon mineralization and trace gas production from thawing permafrost of Northeast Siberia. Glob. Change Biol. 19, 1160–1172 (2013).
    7. Christiansen, H. H. et al. Permafrost and periglacial geomorphology at Zackenberg. Adv. Environ. Res. 40, 151–174 (2008).
    8. Elberling, B. et al. Soil and plant community-characteristics and dynamics at Zackenberg. Adv. Environ. Res. 40, 223–248 (2008).
    9. Christiansen, H. H. et al. Holocene environmental reconstruction from deltaic deposits in northeast Greenland. J. Quat. Sci. 17, 145–160 (2002).
    10. Christiansen, H. H. Nivation forms and processes in unconsolidated sediments, NE Greenland. Earth Surf. Process. Landf. 23, 751–760 (1998).

      3.0.CO;2-A&rft_id=info:pmid/{pubmed}&rft_val_fmt=info:ofi/fmt:kev:mtx:journal&rft.genre=article&rft.aulast=Christiansen&rft.aufirst=H. H.&rft.jtitle=Earth Surf. Process. Landf.&rft.volume=23&rft.spage=751&rft.epage=760&rft.date=1998&rft.atitle=Nivation forms and processes in unconsolidated sediments, NE Greenland&rfr_id=info:sid/nature.com:Nature.com&id=doi:10.1002/(SICI)1096-9837(199808)23:8<751::AID-ESP886>3.0.CO;2-A&id=pmid:{pubmed}&genre=article&aulast=Christiansen&aufirst=H. H.&title=Earth Surf. Process. Landf.&volume=23&spage=751&epage=760&date=1998&atitle=Nivation forms and processes in unconsolidated sediments, NE Greenland&sid=nature:Nature”>

    11. Cornelissen, J. H. C. et al. Global negative vegetation feedback to climate warming responses of leaf litter decomposition rates in cold biomes. Ecol. Lett. 10, 619–627 (2007).
    12. Turetsky, M. R. et al. The disappearance of relict permafrost in boreal North America: Effects on peatland carbon storage and fluxes. Glob. Change Biol. 13, 1922–1934 (2007).
    13. Lee, H. et al. The rate of permafrost carbon release under aerobic and anaerobic conditions and its potential effects on climate. Glob. Change Biol. 18, 515–527 (2012).
    14. Schädel, C. et al. Separating soil CO2 efflux into C-pool-specific decay rates via inverse analysis of soil incubation data. Oecologia 171, 721–732 (2013).
    15. Fang, C. & Moncrieff, J. B. The dependence of soil CO2 efflux on temperature. Soil Biol. Biochem. 33, 155–165 (2001).

    Download references

    Author information

    Affiliations

    1. Center for Permafrost (CENPERM), Department of Geosciences and Natural Resource Management, University of Copenhagen, DK-1350 Copenhagen, Denmark

      • Bo Elberling,
      • Anders Michelsen,
      • Hanne H. Christiansen,
      • Louise Berg &
      • Charlotte Sigsgaard
    2. Geology Department, The University Centre in Svalbard, UNIS, N-9171 Longyearbyen, Norway

      • Bo Elberling &
      • Hanne H. Christiansen
    3. Department of Biology, University of Copenhagen, DK-2100 Copenhagen, Denmark

      • Anders Michelsen
    4. Department of Biology, University of Florida, Gainesville, Florida 32611, USA

      • Christina Schädel &
      • Edward A. G. Schuur
    5. Department of Biosciences, Aarhus University, DK-4000, Roskilde, Denmark

      • Mikkel P. Tamstorf

    Contributions

    B.E. initiated the experimental work in 1996 and compiled data and wrote most of the paper; A.M. carried out most of the chemistry analyses, C.S and E.A.G.S. made the C dynamics model; B.E. and H.H.C. carried out the 2008 permafrost coring, L.B. was involved in the 2008 sampling and data analyses, H.H.C. initiated the 1996 ZEROCALM monitoring as part of the GeoBasis programme and M.P.T. and C.S. were responsible for CALM measurements as part of the GeoBasis programme. All co-authors contributed to the writing.

    Competing financial interests

    The authors declare no competing financial interests.

    Corresponding author

    Correspondence to:

    Supplementary information

  • Double-Glazing and Secondary Glazing

    Double-Glazing

    TheGreenAge > Greenhome > Energy Efficiency > Double-Glazing

    What is Double-Glazing?

    All properties lose heat through their windows. Installing energy efficient double-glazing is an effective way of reducing your energy bills and keeping your home warmer and quieter.

    Double-glazed windows use two sheets of glass with a gap between them which creates an insulating barrier, whilst triple-glazed windows have three sheets of glass. Both options can deliver a high level of energy efficiency; it is not the case that you have to use triple-glazing to gain the most energy efficient window.

    Between the double-glazing glass panes, the space can be filled with either a vacuum (quite rare nowadays; they require excellent sealing, otherwise the vacuum diminishes so the efficiency decreases) or a heavy inert gas such as Argon, Krypton or Xenon. Both these methods are trying to create a more effective insulating barrier, known scientifically as increasing the R-value (which is the measure of thermal resistance).

    Energy efficient double-glazed windows are available in a variety of frame materials (including uPVC and more traditional wood) and styles. These windows vary in their energy efficiency, depending on how well they stop heat from passing out through the window, how much sunlight travels through the glass and how little air can leak in or out around the window.

    Some double-glazing window and door manufacturers helpfully use a window energy rating scheme to show the energy efficiency of their product. This is similar to the one you may have seen on appliances such as your fridge, or washing machine. A-rated windows are the most efficient. To check a window’s energy efficiency before you buy, look at the energy label.

    Questions to ask yourself before Investing in Double-Glazing

    1. How Energy Efficient are the Windows?

    When choosing replacement double-glazed windows, you can check their energy efficiency by looking at the Energy Saving Trust Recommended logo and British Fenestration Rating Council (BFRC) energy label. The Energy Saving Trust endorses any windows rated B or above. The higher the energy rating, the more energy efficient it is. Unfortunately, at the moment there is no obligation for window manufacturers to label their products, however by opting for a highly rated window you know you will be buying the most efficient.

    For a list of all types of double-glazed / triple-glazed windows and their frame material and energy rating, visit the BFRC website.

    2. How many Layers of Glass do you Need?

    Double-glazing has two layers of glass with a gap of around 16mm between them. There’s also the option of triple-glazing, which has three layers of glass. Both A rated double and tripled-glazed windows are available.

    3. What Type of Glass is Best?

    The most energy efficient glass for double-glazing is low emissivity (Low-E) glass. This often has an unnoticeable coating of metal oxide, normally on one of the internal panes – next to the gap. It lets sunlight and heat in but cuts the amount of heat that can get out again.

    4. What’s between the Panes?

    Very efficient windows might use gases like argon, xenon or krypton in the gap, or a vacuum between the two sheets of glass.

    5. What keeps the Panes Apart?

    All double-glazed windows have pane spacers set around the inside edges to keep the two panes of glass apart. For a more efficient window, look for pane spacers containing little or no metal – often known as ‘warm edge’ spacers.

    The BFRC window energy rating scheme checks all the components to ensure the final window achieves the energy efficient standard claimed. This means that you just need to look for the A-G ratings and remember A is best! Alternatively, just look for the Energy Saving Trust Recommended logo which will only be found on glazing that is B rated or above.

    6. Which Frame Suits your Home?

    The frame you choose will depend on your home and your personal taste. For all frame materials there are windows available in each energy rating.

      • uPVC frames are the most common type. They last a long time and can be recycled.
      • Wooden frames can have a lower environmental impact, but require maintenance. They are often used in conservation areas where the original windows were timber framed.
      • Aluminium or steel frames are slim and long-lasting. They can be recycled.
      • Composite frames have an inner timber frame covered with aluminium or plastic. This reduces the need for maintenance and keeps the frame weatherproof.

    7. Do you Need Ventilation?

    Because replacement double-glazed windows will be more airtight than the original single-glazed frames, condensation can build up in your house due to the reduced ventilation.

    If there is not a sufficient level of background ventilation in the room some replacement windows will have trickle vents incorporated into the frame that let in a small amount of controlled ventilation.

    Condensation can sometimes occur on the outside of new low-e glazing. This is because low-e glass reflects heat back into the home and as a result the outside pane remains cool and condensation can build up in cold weather – this isn’t a problem.

    Benefits of Installing Double-Glazing

    Smaller energy bills: replacing all single-glazed windows with energy efficient double-glazing could save you around £135 per year on your energy bills.

    A smaller carbon footprint: by using less fuel, you’ll generate less of the carbon dioxide (CO2) that leads to global warming.

    A more comfortable home: energy efficient glazing reduces heat loss through windows and means fewer draughts and cold spots.

    Peace and quiet: as well as keeping the heat in, energy efficient windows insulate your home against unwanted outside noise.

    Reduced condensation: energy efficient glazing reduces condensation build-up on the inside of windows.

    The costs and savings of double-glazing will be different for each home and each window, depending on the size, material and installer. Savings will also vary depending on how much you currently pay for your heating fuel, these savings are based on a gas heated home.

    Installation Process

    When you plan an installation, you need to know about building regulations and what to do if double-glazing doesn’t suit your property, as well as how to maintain your windows. When you think about replacement glazing, you need to make sure your windows are installed correctly and comply with all the relevant regulations.

    Building Regulations

    Under building regulations in England and Wales new and replacement windows must meet certain energy efficiency requirements:

    New and replacement windows in existing homes in England and Wales must be at least WER band C or U-value 1.6 In Scotland must be at least WER band C or U value 1.6 In Northern Ireland must be at least WER band E or U value 2.0 or centre pane U value 1.2.

    However, if you live in a conservation area, have an ‘article four’ direction on your property or have a listed building, additional regulations are likely to apply. Before you do any work, make sure you check with your local planning office. An ‘article four’ direction removes the right of permitted development, meaning that you will have to apply for planning permission before replacing any windows. This is often applied in conservation areas.

    How to Comply with Regulations

    To make sure regulations are complied with, there are certain rules about the way you can install windows:

      • For DIY installations you must apply for building control approval before installing the windows. For professional installations, your installer should be registered with a competent persons scheme or register the installation through Local Authority Building Control.
      • Competent Persons schemes in England and Wales are the Fenestration Self-Assessment Scheme (FENSA), the British Standards Institution (BSI) or Certass Glazing Scheme.

    Find Registered installers

    FENSA guarantees that its installers and frames comply with building regulations. To find a FENSA registered installer, visit the FENSA website.

    Certass is another scheme that registers and approves installers. To find a Certass registered installer visit the Certass website.

    Ask your installer when you will get a certificate after installation is completed, which demonstrates the installation has been completed in compliance with building regulations.

    Other Options to Improve the Energy Efficiency of your Windows

    If you can’t install double-glazing (e.g. if you live in a conservation area or in a listed building) you have other options:

    Heavy Curtains

    Curtains lined with a layer of heavy material can reduce heat loss from a room through the window at night and cut draughts. They will save some energy, but should only be used as a short term measure.

    Secondary-Glazing

    Secondary-glazing works by fitting a secondary pane of glass and frame, inside the existing window reveal. This is likely to be less effective than replacement windows, as the units tend to be not as well sealed, however it is considerably cheaper than double-glazing. Low emissivity glass is available for secondary-glazing, which will improve the performance.

    – See more at: http://www.thegreenage.co.uk/tech/double-glazing/#sthash.NPXXjgAp.dpuf

  • Water Matters Distribution List

    Water Matters Distribution List <watermatters@ris.environment.gov.au>
    3:29 PM (2 hours ago)

    to watermatters

    Dear subscribers


    Please find the link to the 30th issue of Water Matters below. This issue features stories on a water saving project in Nimmie-Caira, environmental watering in the Lachlan River and funding guidelines for round four of the On-Farm Irrigation Efficiency Program.


    http://www.environment.gov.au/water/publications/watermatters/water-matters-jul-2013.html


    Water Matters provides subscribers with information about the Australian Government’s water reform initiative Water for the Future.


    If you wish to unsubscribe from Water Matters, please follow this link: www.environment.gov.au/water/publications/watermatters/index.html


    _______________________________________________
    Watermatters mailing list
    Watermatters@bode.ris.environment.gov.au
    http://www.environment.gov.au/mailman/listinfo/watermatters