Author: Neville

  • Polar melt confirmed from space

    Ice-Blog

    Climate Change in the Arctic & around the globe

    Polar melt confirmed from space

    Greenland ice wall

    The Greenland ice sheet, photographed 2009 (I.Quaile)

    I am disappointed that there was so little mainstream media coverage (please correct me if I am wrong) of a report from a team of scientists from Germany’s Alfred Wegener Institute (AWI) in Bremerhaven who have analysed just over two years of data from the CryoSat-2 satellite. Their conclusion that the Greenland ice sheet and Antarctica’s glaciers are melting at record pace, dumping some 500 cubic kilometers of ice into the oceans every year, twice as much in the case of Greenland and three times as much in the case of Antarctica, by comparison with 2009 – yes, you read right, we are talking about a very short period for such a dramatic increase in ice loss – should have made more news headlines and not just the science pages.

    To understand the scale of that, the researchers say it would be the equivalent of an ice sheet that’s 600 meters thick and covers an area as big as the German city of Hamburg – or, my colleagues here at DW calculate, as big as Singapore.

    The research team headed by Veit Helm used around two years’ worth of data from the ESA CryoSat-2  satellite to create digital elevation models of Greenland and Antarctica. The results were published in the online magazine of the European Geoscience Union (EGU)  The Cryosphere.

    “The new elevation maps are snapshots of the current state of the ice sheets,” Helm says. “The elevations are very accurate, to just a few meters in height, and cover close to 16 million square kilometers of the area of the ice sheets.” He says this includes an additional 500,000 square kilometers that weren’t covered in previous elevation models from altimetry.

    infografik ice engl

    Space technology shows declining ice mass

    Helm and his team analyzed all data from the CryoSat-2 radar altimeter SIRAL in order to come up with the detailed maps. The satellite with this new radar equipment was launched in 2010. Satellite altimeters measure the height of an ice sheet by sending radar or laser pulses which are then reflected by the surface of the glaciers or surrounding areas of water and recorded by the satellite.

    The researchers used other satellite data as well to document how elevation has changed between 2011 and 2014.

    Rapid ice loss over a short period of time

    The team used more than 200 million SIRAL data points for Antarctica and some 14 million data points for Greenland to create the elevation maps. The results show that Greenland alone is losing around 375 cubic kilometers of ice per year.

    Compared to data which was collected in 2009, the loss of mass from the Greenland ice sheet has doubled. The rate of ice discharge from the West Antarctic ice sheet tripled during the same period.

    I think this is definitely worth talking about. We know the huge implications of polar ice melt for global sea levels. Other research from this year also tells us that, at least in the case of parts of Antarctica, the ice melt is probably irreversible.

    We cannot afford to ignore what is happening to the ice sheets. The extent of ice loss in Greenland is particularly dramatic. I am losing patience with those people who respond to studies like this and our reporting on it by saying “but the East Antarctic is gaining volume” and “the Antarctic sea ice has grown”. It is so easy to take things out of context and mix different factors up when trying to understand a very complex system.

    I will give the last word here to AWI glaciologist Angelika Humbert, who co-authored the study:  ”If you combine the two ice sheets (Greenland and Antarctic), they are thinning at a rate of 500 cubic kilometers per year. That is the highest rate observed since altimetry satellite records began about 20 years ago.” It seems to me there is no arguing with that.

    Related stories:

    Antarctic melt could raise sea levels faster 

    West Antarctic ice sheet collapse unstoppable

    Climate change risk to icy East Antarctica

    Antarctic Glacier’s retreat unstoppable

  • Scientists Create Thin, Transparent Solar Generator

    Scientists Create Thin, Transparent Solar Generator

    By Andy Tully | Thu, 21 August 2014 23:14 | 0

    Benefit From the Latest Energy Trends and Investment Opportunities before the mainstream media and investing public are aware they even exist. The Free Oilprice.com Energy Intelligence Report gives you this and much more. Click here to find out more.

    Not many people think clunky solar roof panels are attractive, but we live with the unsightly installations because they provide clean, renewable energy.

    It would be better if solar power could be generated by nearly invisible means – say a thin, transparent film that lays on the screen of your cell phone or over the windows of your house.

    Select the reports you are interested in:

    NO-SPAM: Under no circumstances will we EVER rent, sell or give away your email

    That’s what a team of researchers at Michigan State University has developed, and the name they came up with sounds like something out of Star Trek: “Transparent luminescent solar concentrator.”

    MSU’s Richard Lunt says the key word is “transparent” because previous attempts to make such a panel work have resulted in weak energy production and, worse, the need for a highly colored panel.

    “No one wants to sit behind colored glass,” says Lunt, an assistant professor of chemical engineering and materials science. “It makes for a very colorful environment, like working in a disco. We take an approach where we actually make the luminescent active layer itself transparent.”

    In an article in the journal Advanced Optical Materials, Lunt and his team reported developing small organic molecules in clear plastic panels that are used to absorb specific, nonvisible wavelengths of sunlight. He said these materials then react with only near-infrared and ultraviolet wavelengths, which then glow at yet another invisible wavelength within the infrared.

    Next, this glowing infrared light is guided to the edge of the plastic panel where thin strips of photovoltaic solar cells convert them to electricity.

    And yet with all this going on in your cell phone or on your window, “because the materials do not absorb or emit light in the visible spectrum, they look exceptionally transparent to the human eye,” Lunt says.

    The new technology has potentially myriad applications. It can work in hand-held devices or be scaled up to commercial and even industrial applications at very little cost. “It opens a lot of area to deploy solar energy in a non-intrusive way,” says Lunt.

    Still, there’s the issue of energy efficiency. For now, the device’s solar conversion efficiency is close to 1 percent, though the team’s goal is to optimize it to achieve efficiencies greater than 5 percent. Previous attempts with colored glass had an efficiency of about 7 percent. Conventional solar panels are about 25 percent efficient.

    Lunt says his team will get there some day. “Ultimately, we want to make solar harvesting surfaces that you do not even know are there.”

    By Andy Tully of Oilprice.com

  • Global Warming’s ‘Missing’ Heat Is Being Stored in the Atlantic Ocean, Scientific Study Says

    view counter

    Tweets

    ICNfreesubscription

    KeystoneBeyondPreviewBlock

    Donate to InsideClimate News through our secure page on Network for Good.

    EagleFordProjectPreviewBlock

    BloombergLegacyPreviewBlock

    CleanBreakAdAmazon

    Global Warming’s ‘Missing’ Heat Is Being Stored in the Atlantic Ocean, Scientific Study Says

    Aug 22, 2014
    (Guardian)

    The key to the slowdown in global warming in recent years could lie in the depths of the Atlantic and Southern Oceans where excess heat is being stored – not the Pacific Ocean as has previously been suggested, according to new research.

    But the finding suggests that a naturally occurring ocean cycle burying the heat will flip in around 15 years’ time, causing global temperature rises to accelerate again.

    The slowdown of average surface temperature rises in the last 15 years after decades of rapid warming has been seized on by climate change sceptics and has puzzled scientists, who have hypothesised that everything from volcanic eruptions and sulphur from Chinese power stations to heat being trapped deep in the oceans could be the cause. Several studies have focused on the Pacific as potentially playing a major role.

    The new study, published in the journal Science on Thursday, concludes that the Pacific alone cannot explain the warming “hiatus” and that much of the heat being trapped by greenhouse gases at record levels in the atmosphere is being sunk hundreds of metres down in the Atlantic and Southern Oceans.

    Ka-Kit Tung, author of the paper and University of Washington professor, said: “The finding is a surprise, since the current theories had pointed to the Pacific Ocean as the culprit for hiding heat. But the data are quite convincing and they show otherwise.”

    “We are not downplaying the role of the Pacific. They are both going on [the oceans having an effect on temperatures]; one is short term [the Pacific], one is long term [the Atlantic],” he told the Guardian.

    A shift in the salinity of the north Atlantic triggered the effect around the turn of the century, the study says, as surface water there became saltier and more dense, sinking and taking surface heat down to depths of more than 300 metres.

    Using temperature data from floats across the world, Tung found the Atlantic and Southern Oceans “each account for just under half the global energy storage change since 1999 at below 300m.” The study’s result, he says, does not support the “Pacific-centric” view of earlier work on whether heat is being stored.

    “We were surprised to see the evidence presented so clearly. When you go with the energy, you cannot argue with that,” said Tung.

  • Dangerous climate change: Myths and reality (1) CLIMATE CODE RED

    Click here to enable desktop notifications for Gmail.   Learn more  Hide
    More

    1 of 1
    AdUTS Master of Teachingwww.uts.edu.au/future-students – Secondary Education 1.5yrs Get set in a new teaching career

    climate code red

    Inbox
    x

    Climate Code Red noreply@blogger.com via google.com

    6:32 PM (2 minutes ago)

    to me

    climate code red


    Dangerous climate change: Myths and reality (1)

    Posted: 21 Aug 2014 05:19 PM PDT

    Part 1 in a 3-part series | Part 2 | Part 3

    by David Spratt

    Download report (16 pages)

    Few would disagree that the world should avoid “dangerous” (or unsafe) climate warming, but what does that term mean? What does climate safety mean? Is climate change already dangerous? Are greenhouse gas levels already too high? This report surveys some recent developments in climate science knowledge as a way of discerning the gaps between myth and reality in climate policy-making.

    Scientific and political reticence

    Amongst advocates for substantial action on climate warming, there is a presumption of agreement on the core climate science knowledge that underlies policy-making, even though differences exist in campaign strategy.

    But the boundaries between science and politics have become blurred in framing both the problem and the solutions. Amongst advocates, advisors and policy-makers there are very different levels of understandings of the core climate science knowledge, how it is changing, what constitutes “danger”, what needs to be done, and at what pace.

    On the science side, the challenge is of a fast-developing discipline in a rapidly changing physical world. There is a concerted and unwarranted global attack on climate scientists and, in Australia, intimidation and fear of job loss generated by the Abbott government’s hostility to science and cuts in climate research funding. As well, there are always uncertainties and unknowns in science, and difficulties in communicating complex understandings in a non-technical manner. Together these factors can produce over-cautiousness in public presentation and scientific reticence.

    In his 2011 climate science update for the Australian Government, Prof. Ross Garnaut gave some “reflections on scholarly reticence”, questioned whether climate research had a conservative “systematic bias”, pointed to “unfortunate delays between discovery and influence in the policy discussion”, and asked “whether the reason why most of the new knowledge confirms the established science or changes it for the worse is scholarly reticence”. Garnaut pointed to a pattern across diverse intellectual fields of research being “not too far away from the mainstream”, but says in the climate field that this “has been associated with understatement of the risks”.

    With masterly restraint, he concluded that we should be “alert to the possibility that the reputable science in future will suggest that it is in Australians’ and humanity’s interests to take much stronger and much more urgent action on climate change than might seem warranted from today’s peer-reviewed published literature. We have to be ready to adjust expectations and policy in response to changes in the wisdom from the mainstream science”  (Garnaut, 2011).

    On the politics side, often insufficient attention is paid to the breadth and depth of published research, and there is a tendency to prioritise perceived political relevance over uncomfortable scientific evidence. Most climate advocacy organisations allocate few resources to critically interrogating the climate research as part of strategy and policy development, and generally fall into a middle-of-the-road advocacy consensus which downplays the warnings from the more forthright scientists whose expert elicitations – on such topics as the stability of ice sheets and sea ice to future sea-level rises – have generally proven more robust than those of their more reticent colleagues.

    A desire amongst advocacy organisations to stick together and present a common mainstream view is understandable, but Garnaut has pointed out the scientific danger, and his observation is just as powerful for climate politics. There is little point in constructing campaign strategies discordant with a fast-changing reality.

    The mainstream representation of climate science as it blurs with politics – in public discourse in Australia, across most civil society sectors, and at the global policy-making level – could reasonably be described as follows:

    • Climate change is not yet dangerous, and two degrees of warming (2°C) is the appropriate focus for policy-making, because 2°C impacts are manageable and big tipping points are unlikely before 2°C.
    • We should plan to mitigate (reduce emissions) for 2°C, but we may fail so we should also plan to adapt to 4°C (which is the likely “business-as-usual” outcome by 2100 if high rates of emission continue).
    • We have a substantial carbon budget left for 2°C, because long-term feedbacks are not materially relevant, and high risks of failure can be accepted because 2°C is a “target” (which can be exceeded) rather than a “cap” (an upper boundary not to be exceeded).
    • Hence, there is time for an orderly, non-disruptive reduction in emissions within the current political and economic paradigm.

    Much of the recent international policy discourse has focused on “what percentage reductions by when and by whom” in emissions would stop warming passing 2°C. In Australia, is it 5% by 2020, or 19%, or a lot more? Till 2030 or 2050? An observer of this discourse would not think that 2°C is other than a reasonable target, and that we have plenty of carbon emissions left for a few decades more. They would certainly not understand that such propositions are dangerous myths. Here’s why.

    Myth 1: Climate change is not yet dangerous

    In 2008 John Holdren, who was then senior advisor to President Barack Obama on science and technology issues, told the Eighth Annual John H. Chafee Memorial Lecture on Science and the Environment: “… the (climate) disruption and its impacts are now growing much more rapidly than almost anybody expected even a few years ago. The result of that, in my view, is that the world is already experiencing ‘dangerous anthropogenic interference in the climate system’ ” (emphasis added) (Holdren, 2008).

    “Dangerous” climate changed is broadly characterised by the Intergovernmental Panel on Climate Change (IPCC) in the “burning embers” diagram as including five “reasons for concern”: risk to unique and threatened systems; risk of extreme weather events; distribution of impacts; aggregate (total economic and ecological) impacts; and risk of large-scale discontinuities (that is, abrupt transitions or “tipping points”). See Figure 1.

    From this perspective, tipping points have already been passed, at less than 1°C of warming, for:

    • The loss of the Amundsen Sea West Antarctic glaciers, and 1–4 metres of sea level rise (Rignot, Mouginot et al., 2014; Joughin, Smith et al., 2014). Dr Malte Meinshausen, advisor to the German government and one of the architects of the IPCC’s Representative Concentration Pathways, calls the evidence published this year of “unstoppable” (Rignot, 2014) deglaciation in West Antarctica “a game changer”, and a “tipping point that none of us thought would pass so quickly”, noting now we are “committed already to a change in coastlines that is unprecedented for us humans” (Breakthrough, 2014).
    • The loss of Arctic sea-ice in summer (Duarte, Lenton et al., 2012; Maslowski, Kinney et al., 2012), which will hasten regional warming, the mobilization of frozen carbon stores, and the deglaciation of Greenland.
    • Numerous ecosystems, which are already severely degraded or in the process of being lost, including the Arctic (Wolf, 2010). In the Arctic, the rate of climate change is now faster than ecosystems can adapt to naturally, and the fate of many Arctic marine ecosystems is clearly connected to that of the sea ice (Duarte, Lenton et al., 2012). In May 2008, Dr Neil Hamilton, who was then director of Arctic programmes for WWF, told a stunned audience (of which I was a member) at the Academy of Science in Canberra that WWF was not trying to preserve the Arctic ecosystem because “it was no longer possible to do so”.

    Many extreme weather events which have been made worse by climate change and variations of the Jet Stream — including Superstorm Sandy, Typhoon Haiyan and extraordinary heat waves in France (2003) and Russia (2010) and associated death tolls of many thousands — are also evidence that climate change is already dangerous.

    The current level of greenhouse gases is around 400 ppm carbon dioxide (parts per million CO2), and 470 ppm carbon dioxide equivalent (CO2e) when other greenhouse gases including methane and nitrous oxide are included. The last time CO2 levels were as high as they are today, humans didn’t exist, and “CO2 values associated with major climate transitions of the past 20 millions years are similar to modern levels” (Tripati, Roberts et al., 2009). In other words, big changes (“transitions”) in significant climate system elements such as ice sheets, sea levels and carbon stores are likely to occur for the current level of CO2. From the study of climate history, we learn that:

    • “During mid-Miocene climatic optimum  [16-14 million years ago] CO2 levels were similar to today, but temperatures were ~3–6C warmer and sea levels 25 to 40 metres higher than at present… When CO2 levels were last similar to modern values (greater than 350 ppmv to 400 pmv), there was little glacial ice on land, or sea ice in the Arctic, and a marine-based ice mass on Antarctica was not viable… Lower levels were necessary for the growth of large ice mass on West Antarctica (~250 to 300 ppmv) and Greenland (~220 to 260 ppmv)” (Tripati, Roberts et al., 2009).
    • “We estimate sea level for the Middle Pliocene epoch [3.0–3.5 million years ago] – a period with near-modern CO2 levels – at 25±5 metres above present, which is validated by independent sea-level data” (Rohling, Grant et al., 2009).
    • Likewise, “during the middle-Pliocene … we find sea level fluctuations of 20-40 metres associated with global temperature variations between today’s temperature and +3°C” (Hansen, Sato et al., 2013).
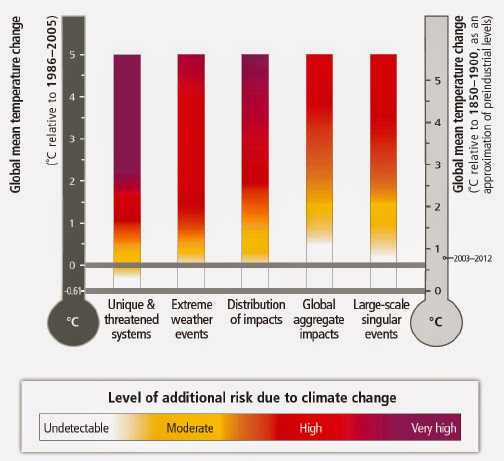
    Figure 1:  The ‘burning embers’ diagram 
from the IPCC’s Fifth Assessment Report illustrates risks for five key areas of concern.  Note that for “Large-scale singular events” (right-hand column) the risk at the current level of warming is assessed as “undetectable”, whereas there is now clear evidence that dangerous tipping points have been already passed for significant elements of 
the climate system.

    Myth 2: Two degrees is an appropriate focus for policy making

    The evidence above indicates that dangerous tipping points have already been passed at the current level of climate warming of 0.8°C, so 2°C of warming is clearly not an appropriate focus for policy making. 2°C is a very unsafe target in any framing of risk. It is more appropriately considered as the boundary between dangerous and very dangerous climate change (Anderson and Bows, 2010). In Australia, 2°C would likely mean, amongst many impacts, the loss of the Great Barrier Reef, the salination of Kakadu, and the loss of the north Queensland tropical rainforests.

    This is consistent with a framework of “planetary boundaries” published in 2009, which “define the safe operating space for humanity with respect to the Earth system and are associated with the planet’s biophysical subsystems or processes” (Rockstrom, Steffen et al., 2009). It proposes a boundary of less than 350 ppm CO2e, compared to the current level of more than 470 ppm CO2e.

    Research also finds that:

    • 1C° of warming over the pre-industrial baseline — which we are now approaching — is hotter than the Holocene maximum (the period of human civilisation up to 1900)  (Marcott, Shakun et al., 2013; Hansen, Kharecha et al., 2013). See Figure 2.
    •  For 2°C of warming, the sea-level rise will likely eventually be measured in the tens of metres (Rohling, Grant et al., 2009).
    • Hansen and Sato (2012), using paleoclimate data rather than models of recent and expected climate change, warn that “goals of limiting human made warming to 2°C and CO2 to 450 ppm are prescriptions for disaster” because significant tipping points – where significant elements of the climate system move from one discrete state to another – will be crossed. As detailed in the next section, numerous tipping points are likely well before 2°C.

    As well, the IPCC considers that the risks to unique and threatened systems, and of extreme weather events, is high at 2°C of warming (see Figure 1).

    Note: References available at PDF download

  • Daily update: How to live off the grid

    1 of 4
    AdDr Green – Solar Powerwww.drgreen.com.au/MonthlySpecial – 5kW System only $4490 + Free Meter or $48/wk. Hurry, ends 22nd August!

    Daily update: How to live off the grid

    Inbox
    x

    Renew Economy editor@reneweconomy.com.au via mail28.wdc01.mcdlv.net

    1:17 PM (51 minutes ago)

    to me
    Energy wars, AGL accuses networks of gold plating; Renewables campaign launches as Abbott heads for bunker; How to live off the grid; How solar, storage, EVs will make homes $1,500/yr better off; The dirty secrets behind ‘Clean Coal’ advertising campaign; Energy policy assessment; Can new small wind companied duplicate success of solar industry; Direct investment in renewables; Can India achieve 100% renewable energy; and grid parity coming in more than half of US states.
    Is this email not displaying correctly?
    View it in your browser.
    RenewEconomy Daily News
    The Parkinson Report
    Retailers set off a turf war against network operators, effectively accusing them of trying to gold plate the network once again, while the retailers suffer the impact has more consumers turn to solar and storage, and consider leaving the grid.
    Save renewables campaign strikes a chord as Abbott prepares to meet key ministers on RET, and renew attempts to kill ARENA, CEFC.
    We’re an average family doing everyday things.  The difference between your morning and ours is that you’re probably pulling your power from the grid.

    UBS says investing in solar, plus battery storage and electric vehicles will make homes much better off than those who rely only on grid.

    Advertising authorities have told Peabody Energy that it can no longer freely dangle its “clean coal” mythology in front of consumers without explanation.
    A round-up of the latest energy policy developments in Australia, US, China, EU, Japan and elsewhere. Australia the only negative for green energy.
    While solar has exploded in the U.S., small wind has struggled to grow. Two startups are hoping to change that.
    The spectre of direct government investment in renewable energy is haunting Australia. Well, it should be.
    By 2050, India could rely entirely on renewable energy to create a sustainable energy future.
    For more than 120 years, homes and businesses have been buying electricity. Now rooftop solar is changing the way hundreds of thousands of homeowners get energy
  • Greenland ice loss doubles from late 2000s

    20 August 2014 Last updated at 14:01

    Greenland ice loss doubles from late 2000s

    By Jonathan Amos Science correspondent, BBC News

    Digital elevation models for Greenland and Antarctica The team has produced elevation models for the ice sheets

    A new assessment from Europe’s CryoSat spacecraft shows Greenland to be losing about 375 cu km of ice each year.

    Added to the discharges coming from Antarctica, it means Earth’s two big ice sheets are now dumping roughly 500 cu km of ice in the oceans annually.

    “The contribution of both ice sheets together to sea level rise has doubled since 2009,” said Angelika Humbert from Germany’s Alfred Wegener Institute.

    “To us, that’s an incredible number,” she told BBC News.

    In its report to The Cryosphere journal, the AWI team does not actually calculate a sea-level rise equivalent number, but if this volume is considered to be all ice (a small part will be snow) then the contribution is likely to be on the order of just over a millimetre per year.

    This is the latest study to use the precision altimetry data being gathered by the European Space Agency’s CryoSat platform.

    CryoSat (Esa) Cryosat uses a radar instrument to measure the shape of polar ice surfaces

    The satellite was launched in 2010 with a sophisticated radar instrument specifically designed to measure the shape of the polar ice sheets.

    The AWI group, led by senior researcher Veit Helm, has taken just over two years’ worth of data centred on 2012/2013 to build what are called digital elevation models (DEMs) of Greenland and Antarctica, and to asses their evolution.

    These models incorporate a total of 14 million individual height measurements for Greenland and another 200 million for Antarctica.

    When compared with similar data-sets assembled by the US space agency’s IceSat mission between 2003 and 2009, the scientists are able then to calculate changes in ice volume beyond just the CryoSat snapshot.

    Negative shifts are the result of surface melting and ice discharge; positive trends are the consequence of precipitation – snowfall.

    Greenland is experiencing the biggest reductions in elevation currently, losing about 375 cu km a year (plus or minus 24 cu km per year), with most of the action occurring at the west and south-east coast of the island.

    Significant thinning is seen also in the North East Greenland Ice Stream (NEGIS).

    “This has three outlet glaciers and one of these, the Zachariae Isstrom, has retreated quite a bit and some volume loss has already been reported. But we see now that this volume loss is really propagating to upper areas, much further into the interior of the ice sheet than has been recorded before,” explained Prof Humbert.

    Elevation change The change in height of Greenland’s ice sheet between January 2011 and January 2014

    In Antarctica, the annual volume loss is about 128 cu km per year (plus or minus 83 cu km per year).

    As other studies have found, this is concentrated in the continent’s western sector, in the area of the Amundsen Sea Embayment.

    Big glaciers here, such as Thwaites and Pine Island, are thinning and retreating at a rapid rate.

    Some thickening is seen also, such as in Dronning Maud Land, where colossal snowfalls have been reported. But this accumulation does not offset the losses occurring in West Antarctica.

    A British-led group recently reported its own Antarctica DEM, using a different algorithm to process the numbers in the CryoSat data.

    The AWI outcomes look very similar, and the German team has transferred the exact same approach to Greenland so it can have confidence in comparing the two ice sheets.

    The losses also look consistent with the analysis coming out of the American Grace mission, which uses a different type of satellite to monitor gravity changes in the polar regions – to, in essence, weigh the amount of ice being dumped into the sea.

    Prof Andy Shepherd, who was part of the British group that reported its findings in May, commented: “This is yet another exciting result from CryoSat, thanks to the team at AWI, charting yet more new ground by providing the first complete survey of ice volume changes in Greenland.

    “However, the increased ice losses that have been detected are a worrying reminder that the polar ice sheets are still experiencing dramatic changes, and will inevitably raise concerns about future global sea-level rise,” the Leeds University researcher said.