Category: General news

Managing director of Ebono Institute and major sponsor of The Generator, Geoff Ebbs, is running against Kevin Rudd in the seat of Griffith at the next Federal election. By the expression on their faces in this candid shot it looks like a pretty dull campaign. Read on

  • What is the cost of climate change to our oceans

    What is the cost of climate change to our oceans?

    An unprecedented study claims to show how the effects of climate change could cost the global marine economy two trillion dollars per year, but this begs the question: how can you cost the oceans?

    The Global Partnership for Oceans launched at World Ocean Summit : Australia's Great Barrier Reef

    The cost of climate change to fisheries could reach $343bn per year by 2100

    Scientists in Sweden claim climate change could cause almost $2tn of damage per year through marine impacts alone by 2100 if emissions continue to rise at current rates.

    Valuing the Ocean, a study by the Stockholm Environment Institute (SEI) is due to be published in June this year and has assigned monetary values to five categories of ocean services in a bid to establish an objective calculation for the costs of climate change to the marine economy.

    The study uses one high- and one low-emissions scenario as defined by the Intergovernmental Panel on Climate Change (IPCC) to show how quick and concerted efforts to minimise global warming could lead to savings of $1.37tn per year – or 0.25% or projected global GDP – by 2100.

    Low- and high-emissions scenarios as modeled by the SEI

    “These figures are just part of the story, but they provide an indication of the price of the avoidable portion of future environmental damage on the ocean – in effect the distance between our hopes and our fears,” says Frank Ackerman, director of SEI’s Climate Economics Group. “The cost of inaction increases greatly with time, a factor which must be fully recognised in climate change accounting.”

    The researchers state that the five areas they have focused on – fisheries, sea-level rise, storms, tourism and the ocean carbon-sink – can all be accurately priced, allowing them to measure the real, monetary costs of climate change.

    According to a preview of the study’s results, the final figures have been calculated using data only on variables that humans can realistically alter and only concerning factors to which an objective price can be assigned.

    An executive summary of the ‘Economic perspectives’ chapter states that the study uses “The most significant and up-to-date climate economics and science literature from a variety of sources.” Further details on the researchers’ source materials are still sketchy at this pre-publication stage.

    Can you do something with the data?

    Data summary

    Projected costs to marine economy in 2050 and 2100

    Click heading to sort table. Download this data

    Category of ocean services
    Low climate impacts 2050 (Billions of 2010 US$)
    High climate impacts 2050 (Billions of 2010 US$)
    Difference 2050 (Billions of 2010 US$)
    Low climate impacts 2100 (Billions of 2010 US$)
    High climate impacts 2100 (Billions of 2010 US$)
    Difference 2100 (Billions of 2010 US$)
    Fisheries 67.5 88.4 20.9 262.1 343.3 81.2
    Sea-level rise 10.3 111.6 101.3 34 367.2 333.2
    Storms 0.6 7 6.4 14.5 171.9 157.4
    Tourism 27.3 58.3 31.1 301.6 639.4 337.7
    Ocean carbon sink 0 162.8 162.8 0 457.8 457.8
    Total 105.7 428.1 322.5 612.2 1979.6 1367.4
    Percent of GDP 0 0 0 0 0 0

    Download the data

    DATA: download the full spreadsheet

    More data

    Data journalism and data visualisations from the Guardian

    World government data

    Search the world’s government data with our gateway

    Development and aid data

    Search the world’s global development data with our gateway

    Can you do something with this data?

    Flickr Please post your visualisations and mash-ups on our Flickr group
    • Contact us at data@guardian.co.uk

    Get the A-Z of data
    More at the Datastore directory

    Follow us on Twitter
    Like us on Facebook

  • Hobart wants our hated monorail – so let them have it

    Hobart wants our hated monorail – so let them have it

    0
    Monorail

    An eyesore for far too long … the ugly, dreaded monorail. Source: The Daily Telegraph

    SYDNEY may have just found an unlikely buyer for its widely despised monorail – Hobart.

    Hobart’s deputy mayor Ron Christie has urged his council to snap up the monorail, claiming the NSW government’s plans to rip down the monstrosity would present an opportunity too good not to investigate.

    The government announced last week it had bought Metro Transport Sydney, the company that owns the city’s monorail and light rail, for $19.8 million.

    Mr Christie said while his monorail idea might sound “wacky”, it could provide and excellent link between North Hobart and the city.

    “The monorail may be too small for Sydney for now, but it’s ideal for the pocket capital of Australia,” he said.


  • Queensland tsunami is heading for federal ALP

    Queensland tsunami is heading for federal ALP

    March 28, 2012

    Opinion

    Beattie enters Labor council team

    Heather Beattie vows to be a “strong local voice” in running as the Labor candidate for Central Ward, as Peter Beattie jokes about making “a range of scones similar to


    Wayne Swan claims mining billionaires threaten our democracy. But the likes of Clive Palmer and Gina Rinehart do not threaten him nearly as much as another, far more important, species – the Queensland voter. The Treasurer was elected to the seat of Lilley on Green preferences. He holds it by 3.2 per cent. On Saturday the Liberal-National Party swept all the state seats in his electorate. On those results Mr Swan will lose his seat at the next election.

    He wouldn’t be alone. Kevin Rudd is sitting on a margin of 8.5 per cent. In 2010 Rudd and Swan won first preference votes of 44 per cent and 41 per cent respectively. Labor’s primary vote at the national level is now closer to 30 per cent. In the Queensland election it was 27 per cent. The result shows how a major party performs when its primary vote starts to limp around 30 per cent. It is not pretty.

    Both Rudd and Swan have lost before – in 1996, when the Coalition was first elected under John Howard. Swan won it back in 1998 when Labor exploited the anti-GST campaign. Labor learned how a government which proposes major reform can be made to pay. And the lesson it took was that under no circumstances should a political party come clean before an election. The electorate should be told what is necessary – “There will be no carbon tax under a government I lead” – and the party should deal with the consequences later.

    alt

    “The consequences for Julia Gillard are coming” … Peter Costello. Photo: Getty Images

    But the consequences catch up with this kind of politics. For Anna Bligh, who promised to retain a subsidy for fuel prices only to abolish it, they came on Saturday. The consequences for Julia Gillard are coming next year.

    There comes a time in the life of a government where it faces the choice to either change course or march to oblivion. At present federal Labor is showing no sign of change. What Gillard should have done after the Queensland debacle was to convene the cabinet and announce that the carbon tax, fixed at $23 a tonne, would be immediately cut and set at a level that applies in comparable countries – say $10, as in Europe. She should have cancelled the monstrous spending on “clean energy” schemes throwing taxpayers’ money after uneconomic proposals that will only ever increase costs for business and consumers. She should have announced reforms to help industry create jobs.

    Instead she flew out of the country to a summit in Korea. The Queensland voters are entitled to conclude they will have to deliver the message a second time around.

    The Queensland campaign was a harbinger of the next federal campaign. Showing no real achievements and no real vision for the state, Queensland Labor focused a personal attack on Campbell Newman and his family. It was unsuccessful. When Bligh was forced to concede there was no evidence behind it she looked shifty and desperate. Without a positive agenda you can expect Labor to mount the mother of all personal attacks on Tony Abbott next year. Already government ministers routinely begin and end their press conferences with attacks on his competence. Anti-Abbott hysteria may not be sweeping the electorate but it is sure sweeping the Labor Party.

    Labor once saw its purpose as supporting skilled and unskilled workers to raise their living standards. But today its historic mission seems to be to stop Tony Abbott. On his first day as Senator, Bob Carr thought the most important statement to make to the press was a line he had rehearsed about Abbott as a “cheapskate hypnotist”. Carr may not understand about sanctions on PNG or the family situation of the recent Taser victim in NSW but he sure understands his main mission in Canberra! He urged his colleagues to “dwell a bit more on the horror of an Abbott-led government” and led off by claiming it would be ”unpredictable”, ”erratic” and ”vicious”.

    The government does not claim it is making life better for average Australians. It does not claim it is keeping down costs of living, improving services or cutting taxes. It claims it is in office to keep Abbott out. Sometimes there is an attack on a billionaire or two to spice things up but it’s still not much of an electoral program.

    Peter Costello is the former federal Liberal Treasurer.

    twitter Follow the National Times on Twitter: @NationalTimesAU

    Read more: http://www.smh.com.au/opinion/politics/queensland-tsunami-is-heading-for-federal-alp-20120327-1vwi1.html#ixzz1qMJnhenC

  • Billions at stake as land valuation system comes under fire

    Billions at stake as land valuation system comes under fire

    March 28, 2012

    Dramatic drop ... private and commercial property values.

    Dramatic drop … private and commercial property values. Photo: Ben Rushton

    WEALTHY landowners are having their private and commercial property values reduced by billions of dollars for land tax and rating purposes after challenging official decisions, prompting concerns from the NSW government about the state’s valuation system.

    Figures compiled by the NSW Valuer General for the past decade show more than 170 cases where there was a variation of more than $5 million between the initial valuation and the valuation after landowners objected or took court action. The total difference between valuations for these cases is about $1.6 billion.

    The properties range from land in two of Australia’s most expensive streets – Wunulla Road and Wolseley Road at Point Piper – to the privately owned Sydney Opera House Car Park.

    Valuation of $68.5 million reduced to $6 million ... the neglected Camden Valley Golf Resort.

    Valuation of $68.5 million reduced to $6 million … the neglected Camden Valley Golf Resort. Photo: Wolter Peeters

    In the case of 55 Wunulla Road, owned by Alan Rydge, the chairman of the hotels and cinema group Amalgamated Holdings Limited, an initial valuation of $17.2 million was knocked down to $9.5 million in 2010 after an appeal to the Land and Environment Court.

    The official land valuation for an apartment block at 128 Wolseley Road came in at $11.7 million in 2009 but was reduced to $4.5 million after the owners lodged an objection.

    The valuation of the Opera House Car Park has fluctuated wildly over a number of years. In 2004 a valuation of $20 million was reduced to $8.9 million on appeal to the court, whereas in 2007 a valuation of $24 million was reduced to $15.4 million.

    In another case, the Camden Valley Golf Resort, some of whose directors are senior rugby league executives, managed to get an initial valuation of $68.5 million reduced to $6 million on appeal in 2004.

    The figures, tabled during a hearing of the parliamentary committee overseeing the work of the office of the Valuer General, have prompted questions about why there is such a significant fluctuation in determinations of land value. The NSW government uses the valuations for the purposes of land tax and compulsory acquisition of land. Councils use them to determine rates.

    Asked about the discrepancies during a hearing of the committee, the Valuer General, Philip Western, said sometimes new information came to light which altered the valuation and that it was not an exact science.

    However, the committee chairman, the MP for Hornsby, Matt Kean, said there were ”serious questions” to be answered by Mr Western. ”We’re seeing examples of the system failing at the top end, which my fear is could be occurring right across the board,” he said.

    The Treasurer, Mike Baird, also said he was concerned by the figures. Last week Mr Baird voiced his frustration about the process following a speech at the Sydney Institute. ”The valuation process [for land tax] drives me crazy,” he said. ”There’s no transparency. No consistency. We need to get much more certainty and transparency.”

    Mr Rydge declined to comment.

  • On Arctic Sea ice melt and coal mine canaries

    On Arctic Sea ice melt and coal mine canaries

    Despite peak global temperatures in 2005 and 2010 (unprecedented in the instrumental record), a recent sharp plunge in volume of the Arctic Sea ice and a spate of extreme weather events, coal mining, coal exports and carbon emissions continue to grow, overwhelming any mitigation attempted by schemes…

    Author

    Disclosure Statement

    Andrew Glikson is Honorary Professor at the Geothermal Energy Centre of Excellence, The University of Queensland, and a Visiting Fellow at the Australian National University.

    The Conversation

    The Conversation is an independent source of information, analysis and commentary from the university and research sector—written by acknowledged experts, curated by professional editors and delivered direct to the public. read more

    Articles by This Author

    24 February 2012 Is another mass extinction event on the way?30 January 2012 We do need drastic action on climate change: a response to the Wall Street Journal18 January 2012 As emissions rise, we may be heading for an ice-free planet 8 December 2011 Last chance at Durban? The geological dimension of climate change23 September 2011 An Orwellian climate

    Kv97mq2h-1332378179 Melting Arctic Sea ice should be the warning we need about expanding coal exports. Michael Sonnabend

    Despite peak global temperatures in 2005 and 2010 (unprecedented in the instrumental record), a recent sharp plunge in volume of the Arctic Sea ice and a spate of extreme weather events, coal mining, coal exports and carbon emissions continue to grow, overwhelming any mitigation attempted by schemes such as the Australian carbon price.

    And although both – local emissions and emissions from exported Australian coal – are vented into the same atmosphere, in political terms it appears as if they occur on different planets.

    Following the peak El-Niño event of 1998, when mean global temperatures reached +0.45 degrees Celsius above pre-1975 levels, a decline of temperatures during 1999-2000 was heralded as “global cooling”, reversing the rise in mean temperature of about +0.8C since early in the 20th century (see figure 1).

    Unfortunately from 2001 temperatures continued to rise. There were peak temperatures of +0.46C (2005) and +0.47C (2010) in the instrumental record (see figure 1). The 2011 La-Niña year saw the peak temperature of 0.4C higher than all previously recorded La-Niña years.

    The rise in mean global temperature would be about double the above figures, had it not been for the transient masking effects of short-lived sulphur aerosols emitted from fossil fuel combustion. However, with the onset of clean air policies in the 1980s, SO₂ emissions began to decline (see figure 2), which in part explains the sharp rise in temperatures from about 1975-1976 (see figure 1).

    Figure 1: NASA, the US National Climatic Data Centre, and the UK Hadley Centre have each produced global temperature datasets. The graph shows the annual means calculated from the three datasets. Years beginning with an El Niño (orange) and La Niña (blue) are shown. http://www.csiro.au/Outcomes/Climate/Understanding/State-of-the-Climate-2012.aspx

    Click to enlarge

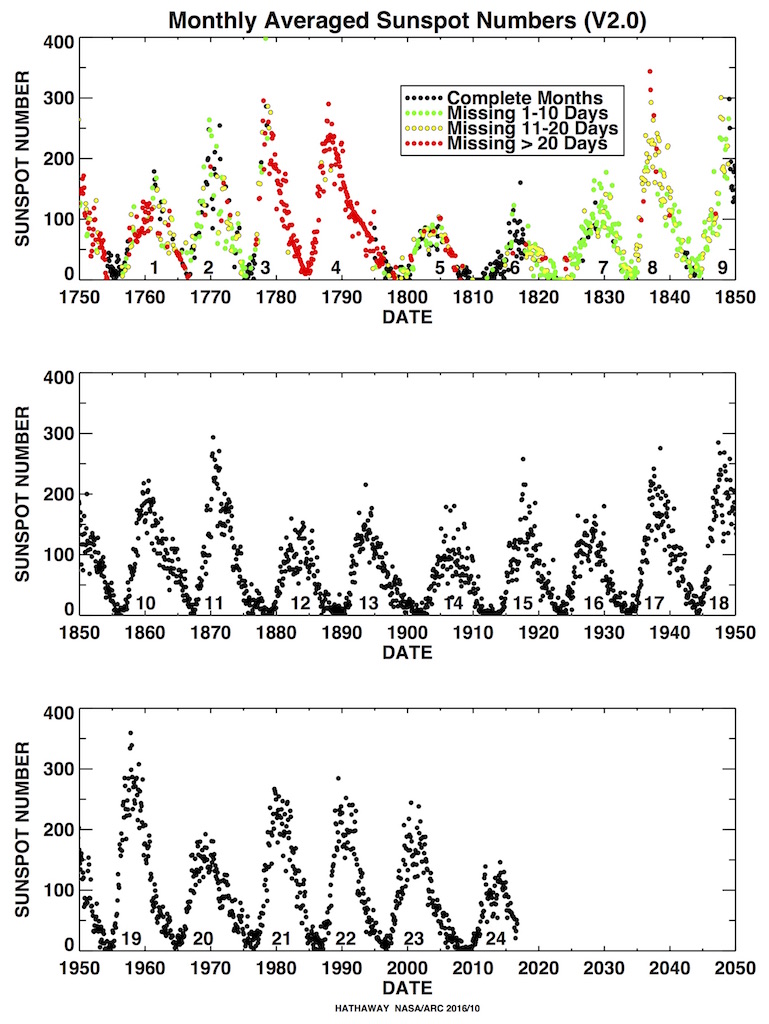
    Factors underlying lower temperatures about 1999-2000 include the resurgence of sulphur emission from industry, in particular in growing economies (China, Middle East, Africa) (see figure 2). The role of the 11 years sun spot cycle is minor, contributing to temperature rise from the mid-1980s (1365.6 to 1366.5 Watt/m2) and to the relatively cool La-Niña dominated period during 2008 (see figure 3).

    Typically the rise in global temperature is amplified in the polar regions by factors up to 4 and 5. Thus, of the parameters reflecting global warming, the state of the Arctic Sea ice is one of the most sensitive, often referred to as the “canary in the coal mine”.

    Figure 2: Global industrial sulphur emissions during 1850 – 2010. www.atmos-chem-phys.net/11/1101/2011/acp-11-1101-2011.pdf

    Click to enlarge

    The opening of a summer open-water ocean in the Arctic, absorbing infrared radiation where the electromagnetic spectrum was previously reflected back to space, is bound to have major implications for the global climate patterns. Since 2009, abrupt steepening of Arctic Sea ice melt rate (see figure 4), has led a group of UK scientists to call for urgent geo-engineering to cool the Arctic.

    Such measures would likely hinge on stratospheric injection of sulphur dioxide from jet planes flying high over the Arctic, increasing atmospheric albedo for relatively short periods on time scales of weeks to months. Sulphur will need to be re-injected over the long term unless and until levels of atmospheric greenhouse gases decline.

    Figure 3: Sun spot numbers between 1950 and 2011. http://solarscience.msfc.nasa.gov/images/Zurich_Color_Small.jpg

    Click to enlarge

    So far as the carbon emissions are concerned, however, business as usual goes on and infrastructure of fossil fuel exploitation continues to be expanded in several parts of the world, including Australia’s coal mining and coal export industry. According to ABARE’s report “Australian coal exports outlook to 2025 and the role of infrastructure” (Table 8 of the report), Australia’s coal exports are due to grow from a total of 306 Million ton coal (MtCoal) in 2012 to 394 MtCoal in 2025. For an average grade of ~80% carbon in high-quality coal, this translates to between 245 MtCarbon in 2012 to 315 MtCarbon in 2025.

    Annual emissions from Australian coal exports were near double the Australian annual carbon emissions during 1990-2008 (~420 to 550 MtCO₂-equivalent per year = 114 to 150 MtCarbon per year) (see figure 2.1 in Australian Greenhouse Emissions Information System).

    Figure 4: Arctic sea ice volume anomaly from PIOMAS updated once a month. Daily Sea Ice volume anomalies for each day are computed relative to the 1979 to 2011 average for that day of the year. Tick marks on time axis refer to 1st day of year. The trend for the period 1979-present is shown in blue. Shaded areas show one and two standard deviations from the trend. Error bars indicate the uncertainty of the monthly anomaly. http://psc.apl.washington.edu/wordpress/research/projects/arctic-sea-ice-volume-anomaly/#

    Click to enlarge

    If local emissions for 2007 (540 MtCO₂ = 147 MtCarbon) (excluding land use-related carbon loss) are combined with 2007 emissions from Australian coal exports (262*0.8 = 210 MtCarbon) (Table 8), the total of ~357 MtCarbon constitutes ~4.5 percent of 2007 global emission of ~7900 MtCarbon. Quadrupling Australia’s coal exports would increase Australia’s total direct and indirect emissions to over 1 billion tons (1 GtCarbon).

    Figure 5: Mouna Loa 1970 – 2012 trends in (A) CO2; (B) Methane; (C) 18O/16O (decreasing – representing relative increase in 16O and thereby rising temperatures), and (D) N2O. http://www.esrl.noaa.gov/gmd/ccgg/trends/

    Click to enlarge

    Compared to total emissions from local combustion and exported coal, Australia’s carbon price – planned to reduce emissions by 5-25% by 2020 relative to 2000 emissions (2000 emissions – 500 MtCO₂ = 136 MtCarbon) – would bring emissions down to 129 or 102 MtC per year, respectively. Such reduction would be cancelled out by the growth in coal exports.

    Global emissions since 1750, totalling 352,000 MtCarbon from combustion and 152,000 MtCarbon from land clearing, have driven atmospheric CO₂ levels to 393 ppm (see figure 5), the highest it has been since the Pliocene some 3 million years ago. Current CO₂ rise rates near 2 ppm CO₂/year are unprecedented in the last 65 million years of geological history.


  • Analyst sees nighmare scenario for labor

    Analyst sees nightmare scenario for Labor

    Peter Martin

    March 27, 2012

    Federal Labor sinks with Queensland

    Julia Gillard is out of the country but she can’t ignore an opinion poll putting Labor’s primary vote barely one point above its state election result

    Labor would be left without a single seat in Queensland if the state voted federally the way it did on Saturday night.

    The ABC’s election analyst, Antony Green, said the numbers point to a federal wipeout for Labor in Queensland, with no seats remaining – not even those of the Deputy Prime Minister, Wayne Swan, the Trade Minister, Craig Emerson, or the former leader Kevin Rudd.

    But he says there is no reason to believe Queenslanders will vote the same way.

    .

    ”People still vote on habit” … Antony Green. Photo: Jacky Ghossein

    “You only need to look at 2001 and 2004. In 2004 Labor got smashed in Queensland federally when Mark Latham was leader, absolutely smashed. Yet earlier that year Peter Beattie won the state election for Labor with a massive landslide.

    “The same people who were giving John Howard huge majorities federally were voting for Bob Carr in NSW and Peter Beattie in Queensland.”

    Green believes Australians increasingly treat state and federal elections differently, with the federal voting intentions much more stable.

    “People still vote on habit, but more and more that’s only evident at federal elections. At state polls you see massive swings.

    “I suspect that’s because state government is about managing things – making sure the trains run on time and roads are built. State governments are rewarded or punished for performance, whereas at the federal level it’s along more ideological lines.”

    The Macquarie University election specialist Murray Goot agrees but says the importance of the Queensland vote is that it shows Labor is not gaining any votes.

    “If one or two independents lose their seats at the next election Labor will need to gain seats in order to survive. It is now extraordinarily difficult to see that happening,” he said.

    Green said if the swing against Labor in Queensland was to be repeated at the federal election Labor would have much more to worry about than Queensland.

    “In 2010 Labor had a swing against it in NSW that didn’t cost it any seats, it had a swing to it in Victoria. If it did lose another 7 or 8 per cent in Queensland at the next federal election it would lose its remaining eight seats, but it would get slaughtered in NSW where many more are held by thin margins.

    “People keep saying the next election could be lost in Queensland. My view is that if it is lost in Queensland it is not going to be lost in Queensland alone.”

    twitter Follow the National Times on Twitter: @NationalTimesAU

    Read more: http://www.smh.com.au/opinion/political-news/analyst-sees-nightmare-scenario-for-labor-20120326-1vupf.html#ixzz1qJlvPEYV