|
Ad350% + Investment Returns – private-client-investments.com – High Yield Recession Proof Products -Minimal Risk- Special Tax Credits!
|
Daily update: No progressive ideas, please, we’re Australian
|
||||||||||||||||||||||||||||||||||||||||
|
Ad350% + Investment Returns – private-client-investments.com – High Yield Recession Proof Products -Minimal Risk- Special Tax Credits!
|
Daily update: No progressive ideas, please, we’re Australian
|
||||||||||||||||||||||||||||||||||||||||
There’s a lot to like about solar power: It’s clean, it’s getting less expensive, and it’s probably the most sustainable form of energy available. But conventional solar cells have their drawbacks, and one is that up to 20 percent of the Sun’s energy they capture is lost when the electrons move from the solar panel to its storage battery.
Now a team of researchers at Ohio State University (OSU) working under Yiying Wu, a professor of chemistry and biochemistry, has devised a hybrid solar battery that not only can capture solar energy but store virtually all the energy it collects.
At the heart of the solution is a solar panel in mesh form, which permits a free flow of air, and a new technique for transferring electrons from the solar panel to the battery’s electrode. In the device, oxygen and light work to enable the multiple chemical reactions necessary to charge the battery.
Related: Could Solar Provide 27% Of World’s Energy By 2050?
“The state of the art is to use a solar panel to capture the light, and then use a cheap [lithium-ion] battery to store the energy,” Wu said in an interview with the OSU Newsroom. “We’ve integrated both functions into one device. Any time you can do that, you reduce cost.”
By how much? By one-fourth, Wu says.
The OSU technology, described in detail in the Oct. 3 issue of the journal Nature Communications, works this way: The solar panel allows sunlight captured by the solar cell to be converted into electrons inside the battery, a process that wastes virtually none of the electrons. These electrons are produced from sunlight that shines onto the mesh of the solar panel.
The built-in battery, meanwhile, contains lithium peroxide, which decomposes into lithium ions and oxygen. The oxygen is released into the air that flows through the mesh, while the lithium ions are transformed into lithium metal and stored safely in the battery.
The current design is based, at least in part, on a high-efficiency, air-powered battery developed previously by Wu and a doctoral student, Xiaodi Ren. That battery feeds power through a chemical reaction between oxygen and potassium.
Related: How A Mistake May Lead To More Efficient Solar Power
“Basically, it’s a breathing battery,” Wu explained. “It breathes in air when it discharges, and breathes out when it charges.”
That design was awarded the $100,000 clean energy prize from the U.S. Department of Energy in 2014, allowing Wu to form KAir Energy Systems LLC to develop the new technology. And that development was to combine the KAir battery with a solar panel.
Conventional solar cells, however, are made of solid panels, which keep air away from the battery. So another of Wu’s doctoral students, Mingzhe Yu, developed the mesh for the hybrid, made from titanium gauze on which he managed to grow vertical rods of titanium dioxide as if they were blades of grass on a lawn. Air flows through the gauze while the rods capture the sunlight.
By Andy Tully of Oilprice.com
More Top Reads From Oilprice.com:
Read scientific analysis on Arctic sea ice conditions. We provide an update during the first week of each month, or more frequently as conditions warrant.
ABOUT THESE IMAGES
The sun has set over the central Arctic Ocean and Arctic sea ice extent is now increasing. Sea ice extent in Antarctica appears to have passed its seasonal maximum. The peak Antarctic value recorded so far of over 20 million square kilometers (7.7 million square miles) sets a new record over the period of satellite observations.
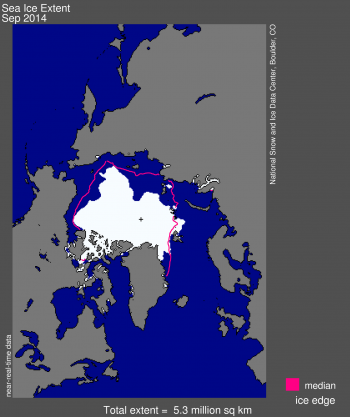
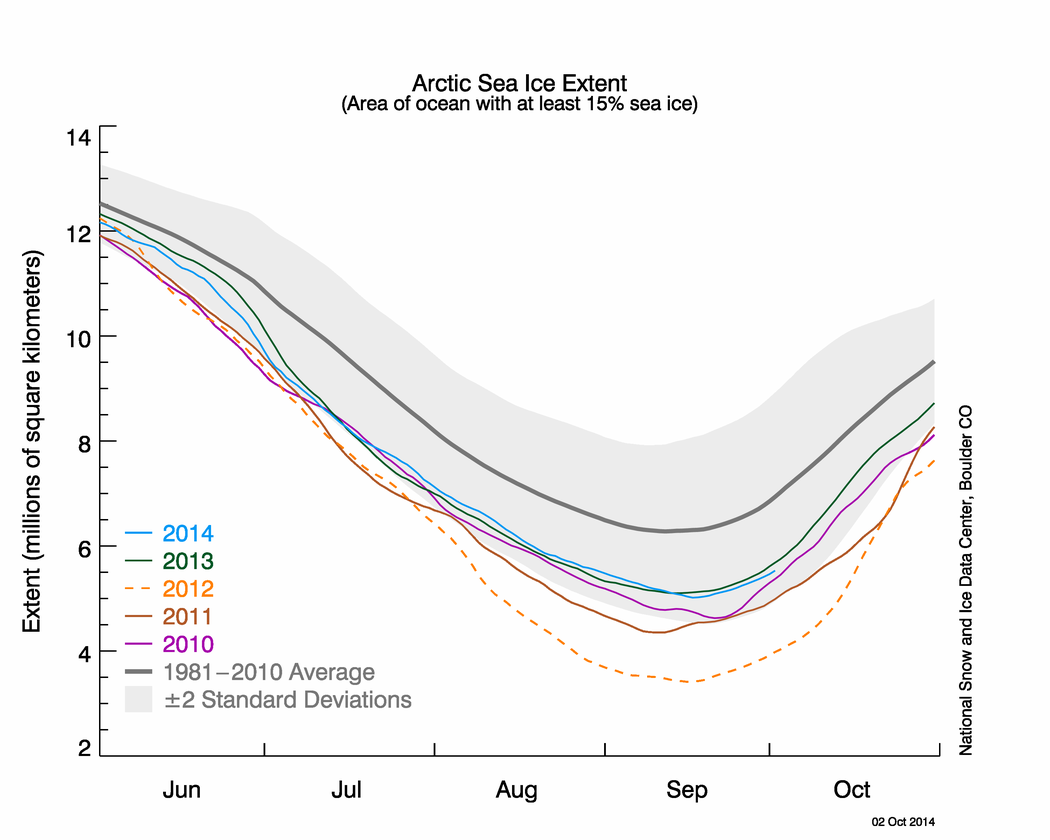
Following the seasonal daily minimum of 5.02 million square kilometers (1.94 million square miles) that was set on September 17, 2014 (6th lowest in the satellite record), Arctic sea ice has started its seasonal cycle of growth. Arctic sea ice extent averaged for the month of September 2014 was 5.28 million square kilometers (2.04 million square miles), also the 6th lowest in the satellite record. This is 1.24 million square kilometers (479,000 square miles) below the 1981 to 2010 average extent, and 1.65 million square kilometers (637,000 square miles) above the record low monthly average for September that occurred in 2012.
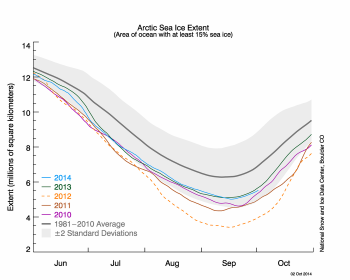
Because ice extent falls through the first part of September and rises in the latter part, statistics on the average daily rate of ice loss or gain through the month are largely meaningless. More relevant is the total ice loss through the melt season. Between the seasonal maximum extent that occurred on March 21, 2014 and the September 17 minimum, the Arctic Ocean lost a total of 9.89 million square kilometers (3.82 million square miles) of ice, which is the 9th largest in the satellite record, but the least amount of seasonal loss since 2006. This year’s loss was 1.92 million square kilometers 741,000 square miles) less than the total loss that occurred in 2012.
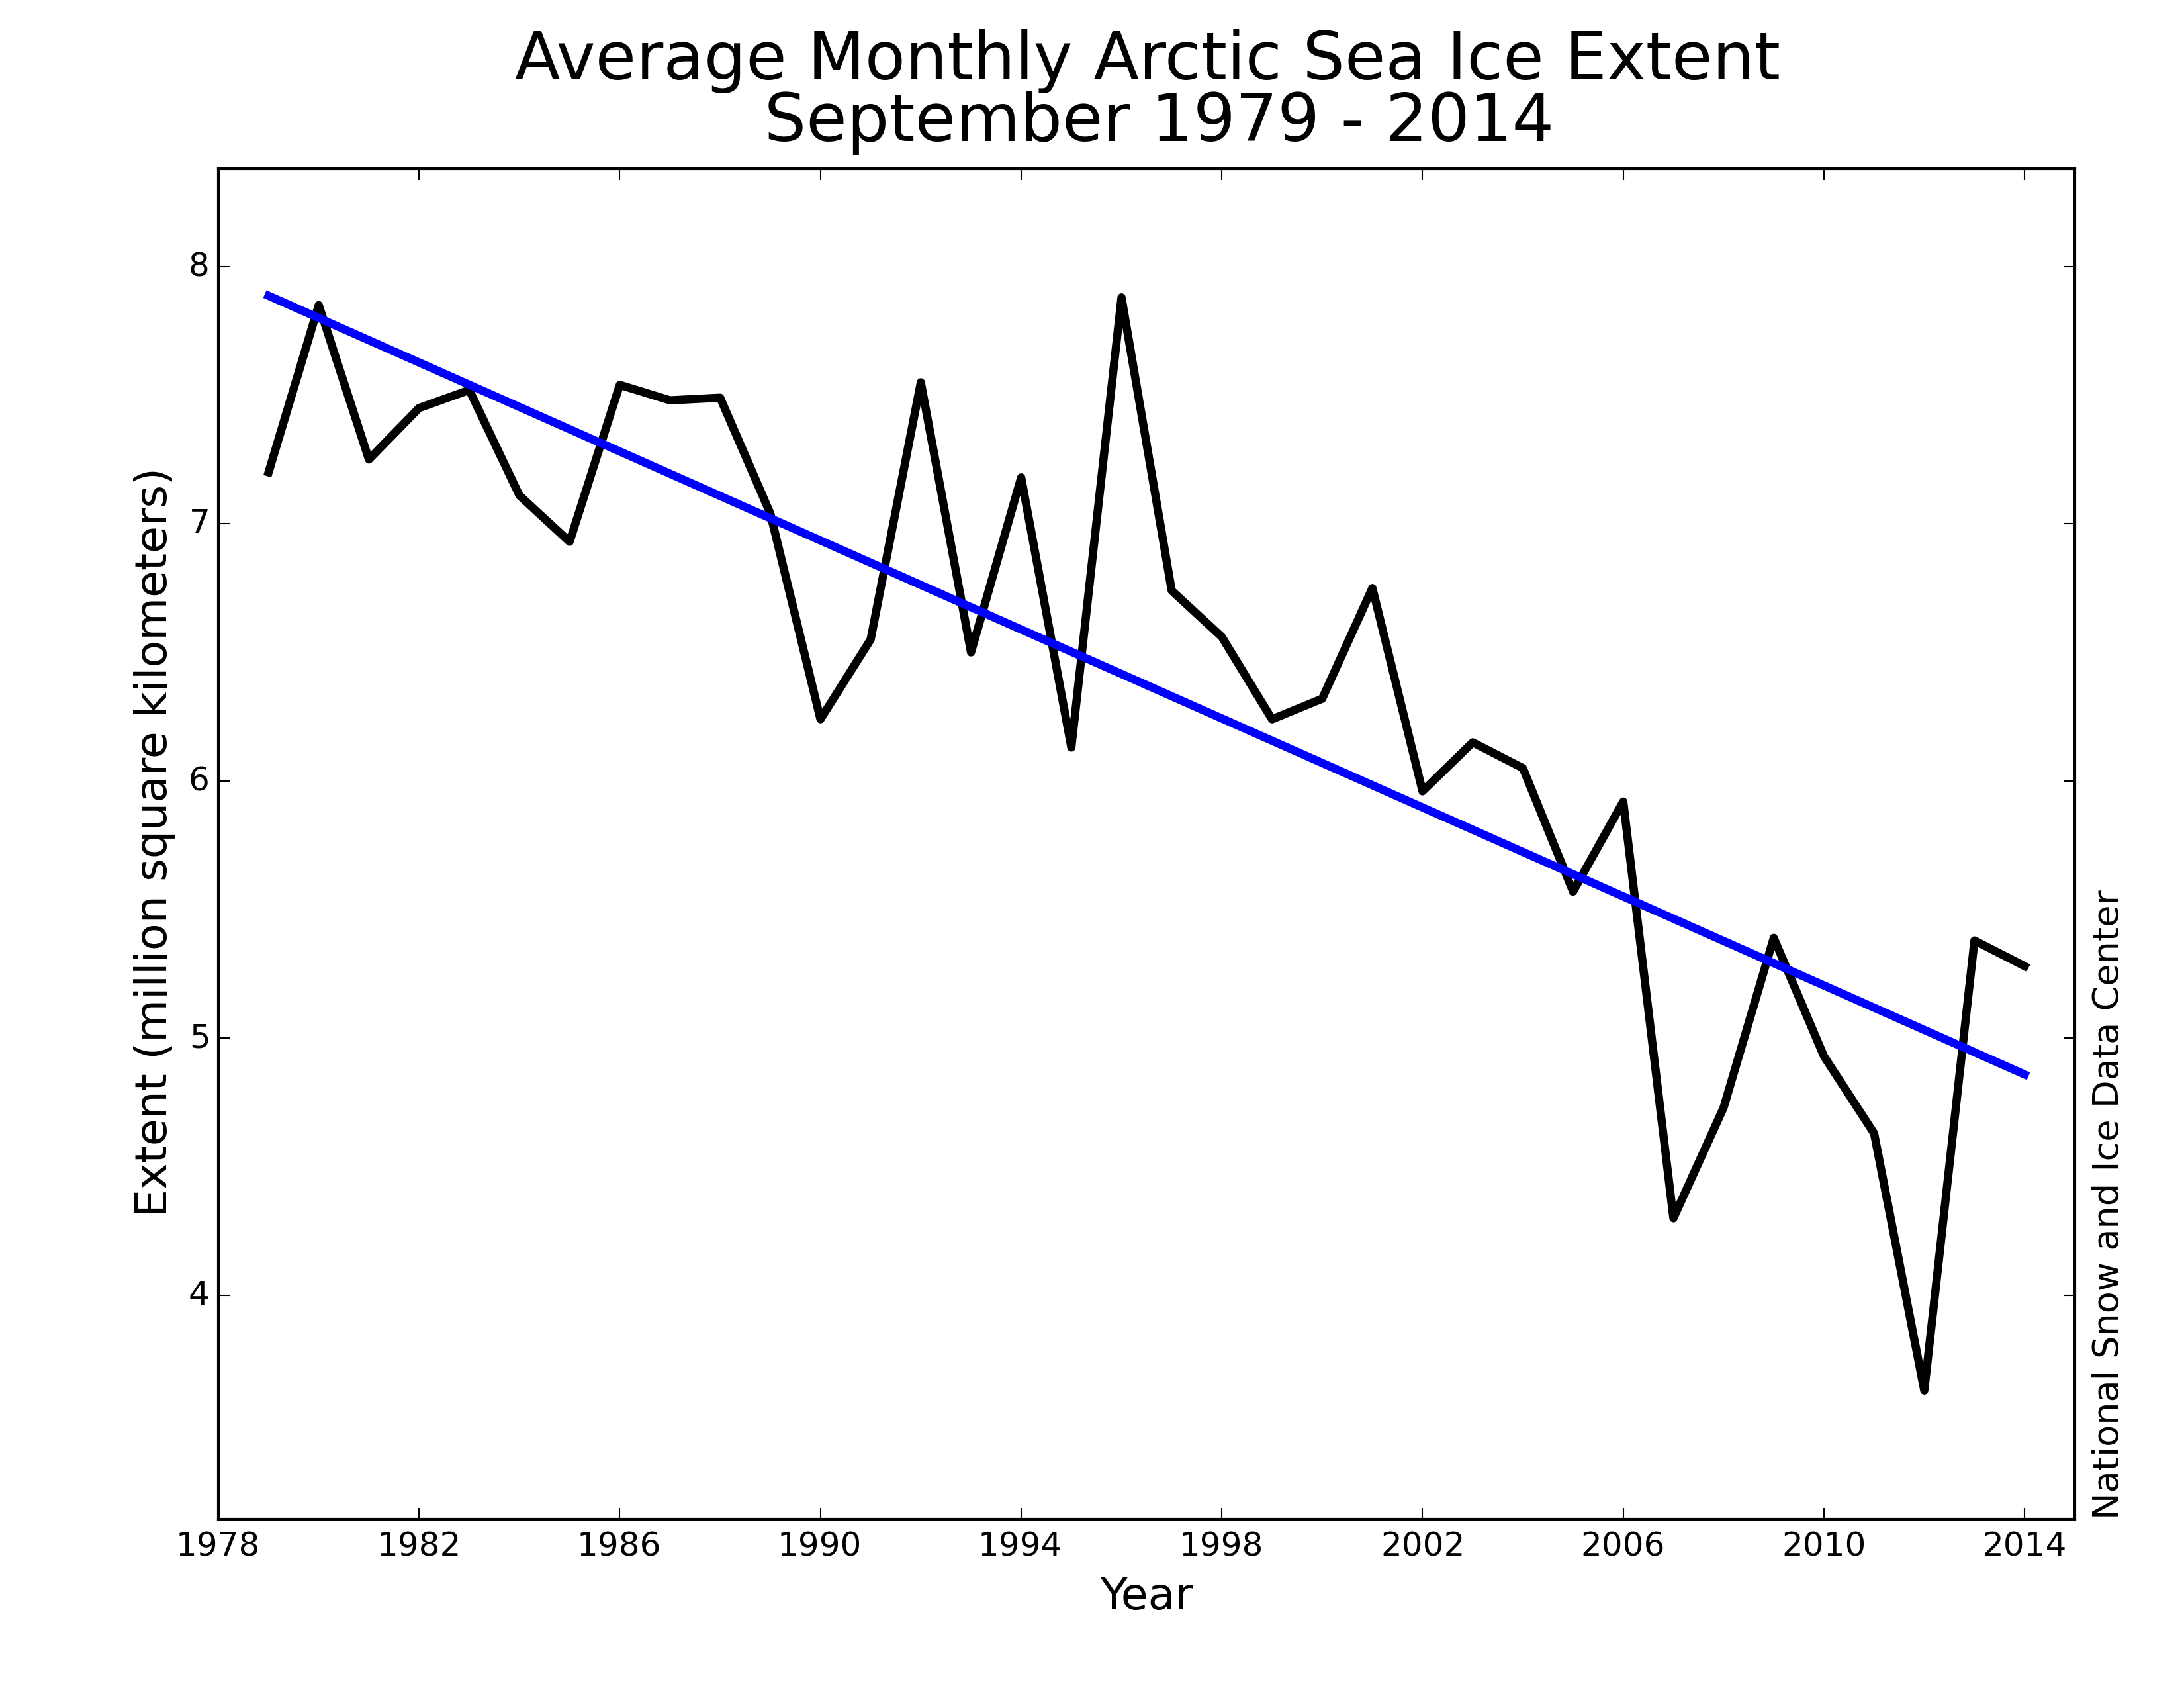
Through 2014, the linear rate of decline for September Arctic ice extent over the satellite record is 13.3% per decade, relative to the 1981 to 2010 average. The ten lowest September ice extents over the satellite record have all occurred in the last ten years.
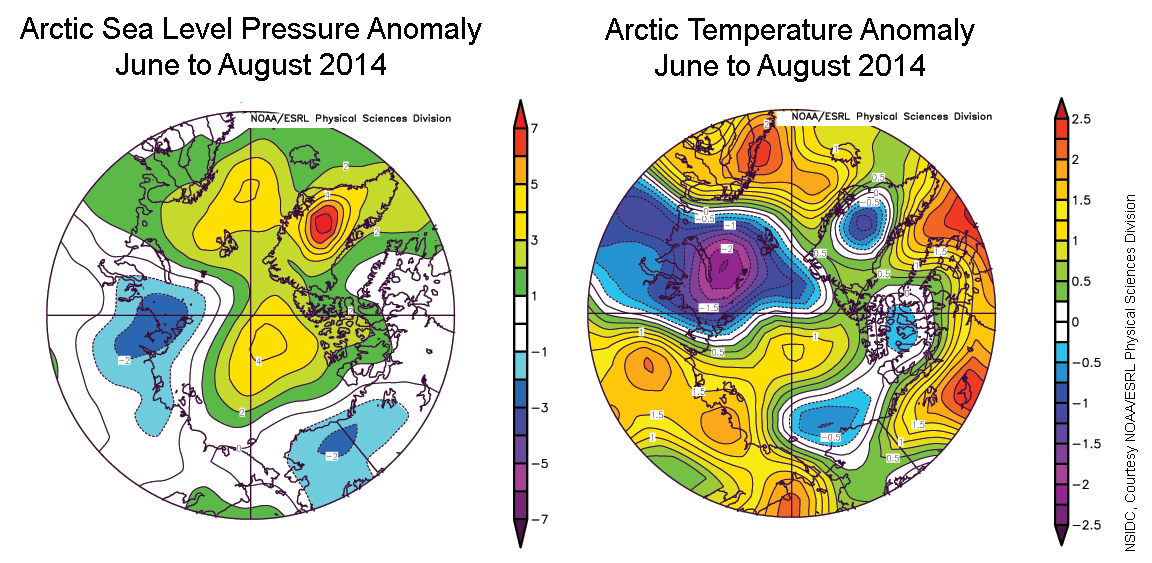
Weather conditions prevailing over the summer of 2014 were unremarkable. Compared to the long term (1981 to 2010) climatology, sea level pressure over the period June through August was higher than average over much of the central Arctic Ocean, the Atlantic sector of the Arctic, and Greenland. While air temperatures at the 925 hPa level (approximately 3000 feet altitude) were slightly above average over part of the central Arctic Ocean, they were below average over the Kara Sea and just north of Alaska. The summer of 2013, which is now the 7th lowest ice extent in the satellite record, was also generally unremarkable in terms of temperature. Both of these years contrast sharply with 2012, which saw unusually warm conditions across the Arctic Ocean. The one significant weather pattern over the summer was a larger than normal pressure gradient over the Laptev Sea that drove southerly winds, brought warmer air, and helped drive sea ice northward. This led to the tongue of open water that reached to within 5 degrees latitude of the pole. However, this pressure gradient was not particularly extreme so thinner ice cover in the area was also a significant contributor to the open water near the pole. Sea surface temperatures may also have played a role, as we discussed in a previous post.
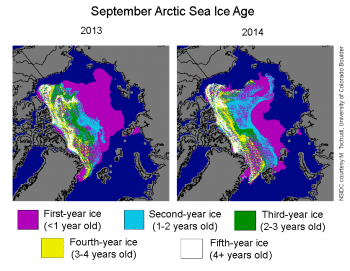
The distribution of sea ice age at the time of the minimum provides some insights into the summer evolution of the ice cover. For ice that is three years and older, the distribution is similar to recent years, with most of this ice along the northern coast of Greenland and northwestern coast of the Canadian Archipelago. Through the winter, older ice moved across the Beaufort and Chukchi seas due to the typical clockwise circulation of the Beaufort Gyre. Similar to recent summers, much of this ice melted away, though this year it lasted through most of the summer, contributing to the relatively late development of open water along the Alaskan coast.
One notable feature this year compared to last year is that a tongue of second-year ice (ice that is 1 to 2 years old) persisted north and east of the East Siberian Sea. This likely helped limit the loss of ice in this region and kept the ice edge much farther southward than in the neighboring Laptev Sea to the east. The predominance of thinner first-year ice in the Laptev region, along with persistent southerly winds, led to seasonal retreat of the ice edge to north of 85 degrees North latitude.
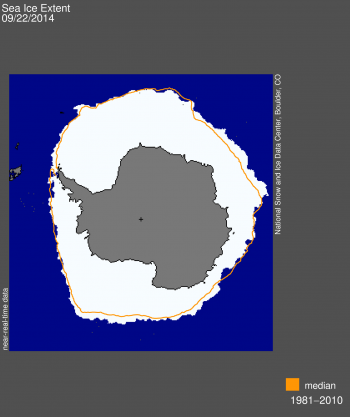
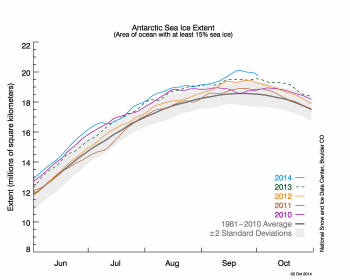
As we reported in our Arctic minimum announcement, sea ice in Antarctica has remained at satellite-era record high daily levels for most of 2014. On September 22, 2014, Antarctic ice extent increased to 20.11 million square kilometers (7.76 million square miles). This was the likely maximum extent for the year.
This year’s Antarctic sea ice maximum was 1.54 million square kilometers (595,000 square miles) above the 1981 to 2010 average maximum extent, which is nearly four standard deviations above this average. The 2014 ice extent record is 560,000 square kilometers (216,000 square miles) above the previous record ice extent set on October 1, 2013. Each of the last three years (2012, 2013, and 2014) has set new record highs for extent in the Antarctic.
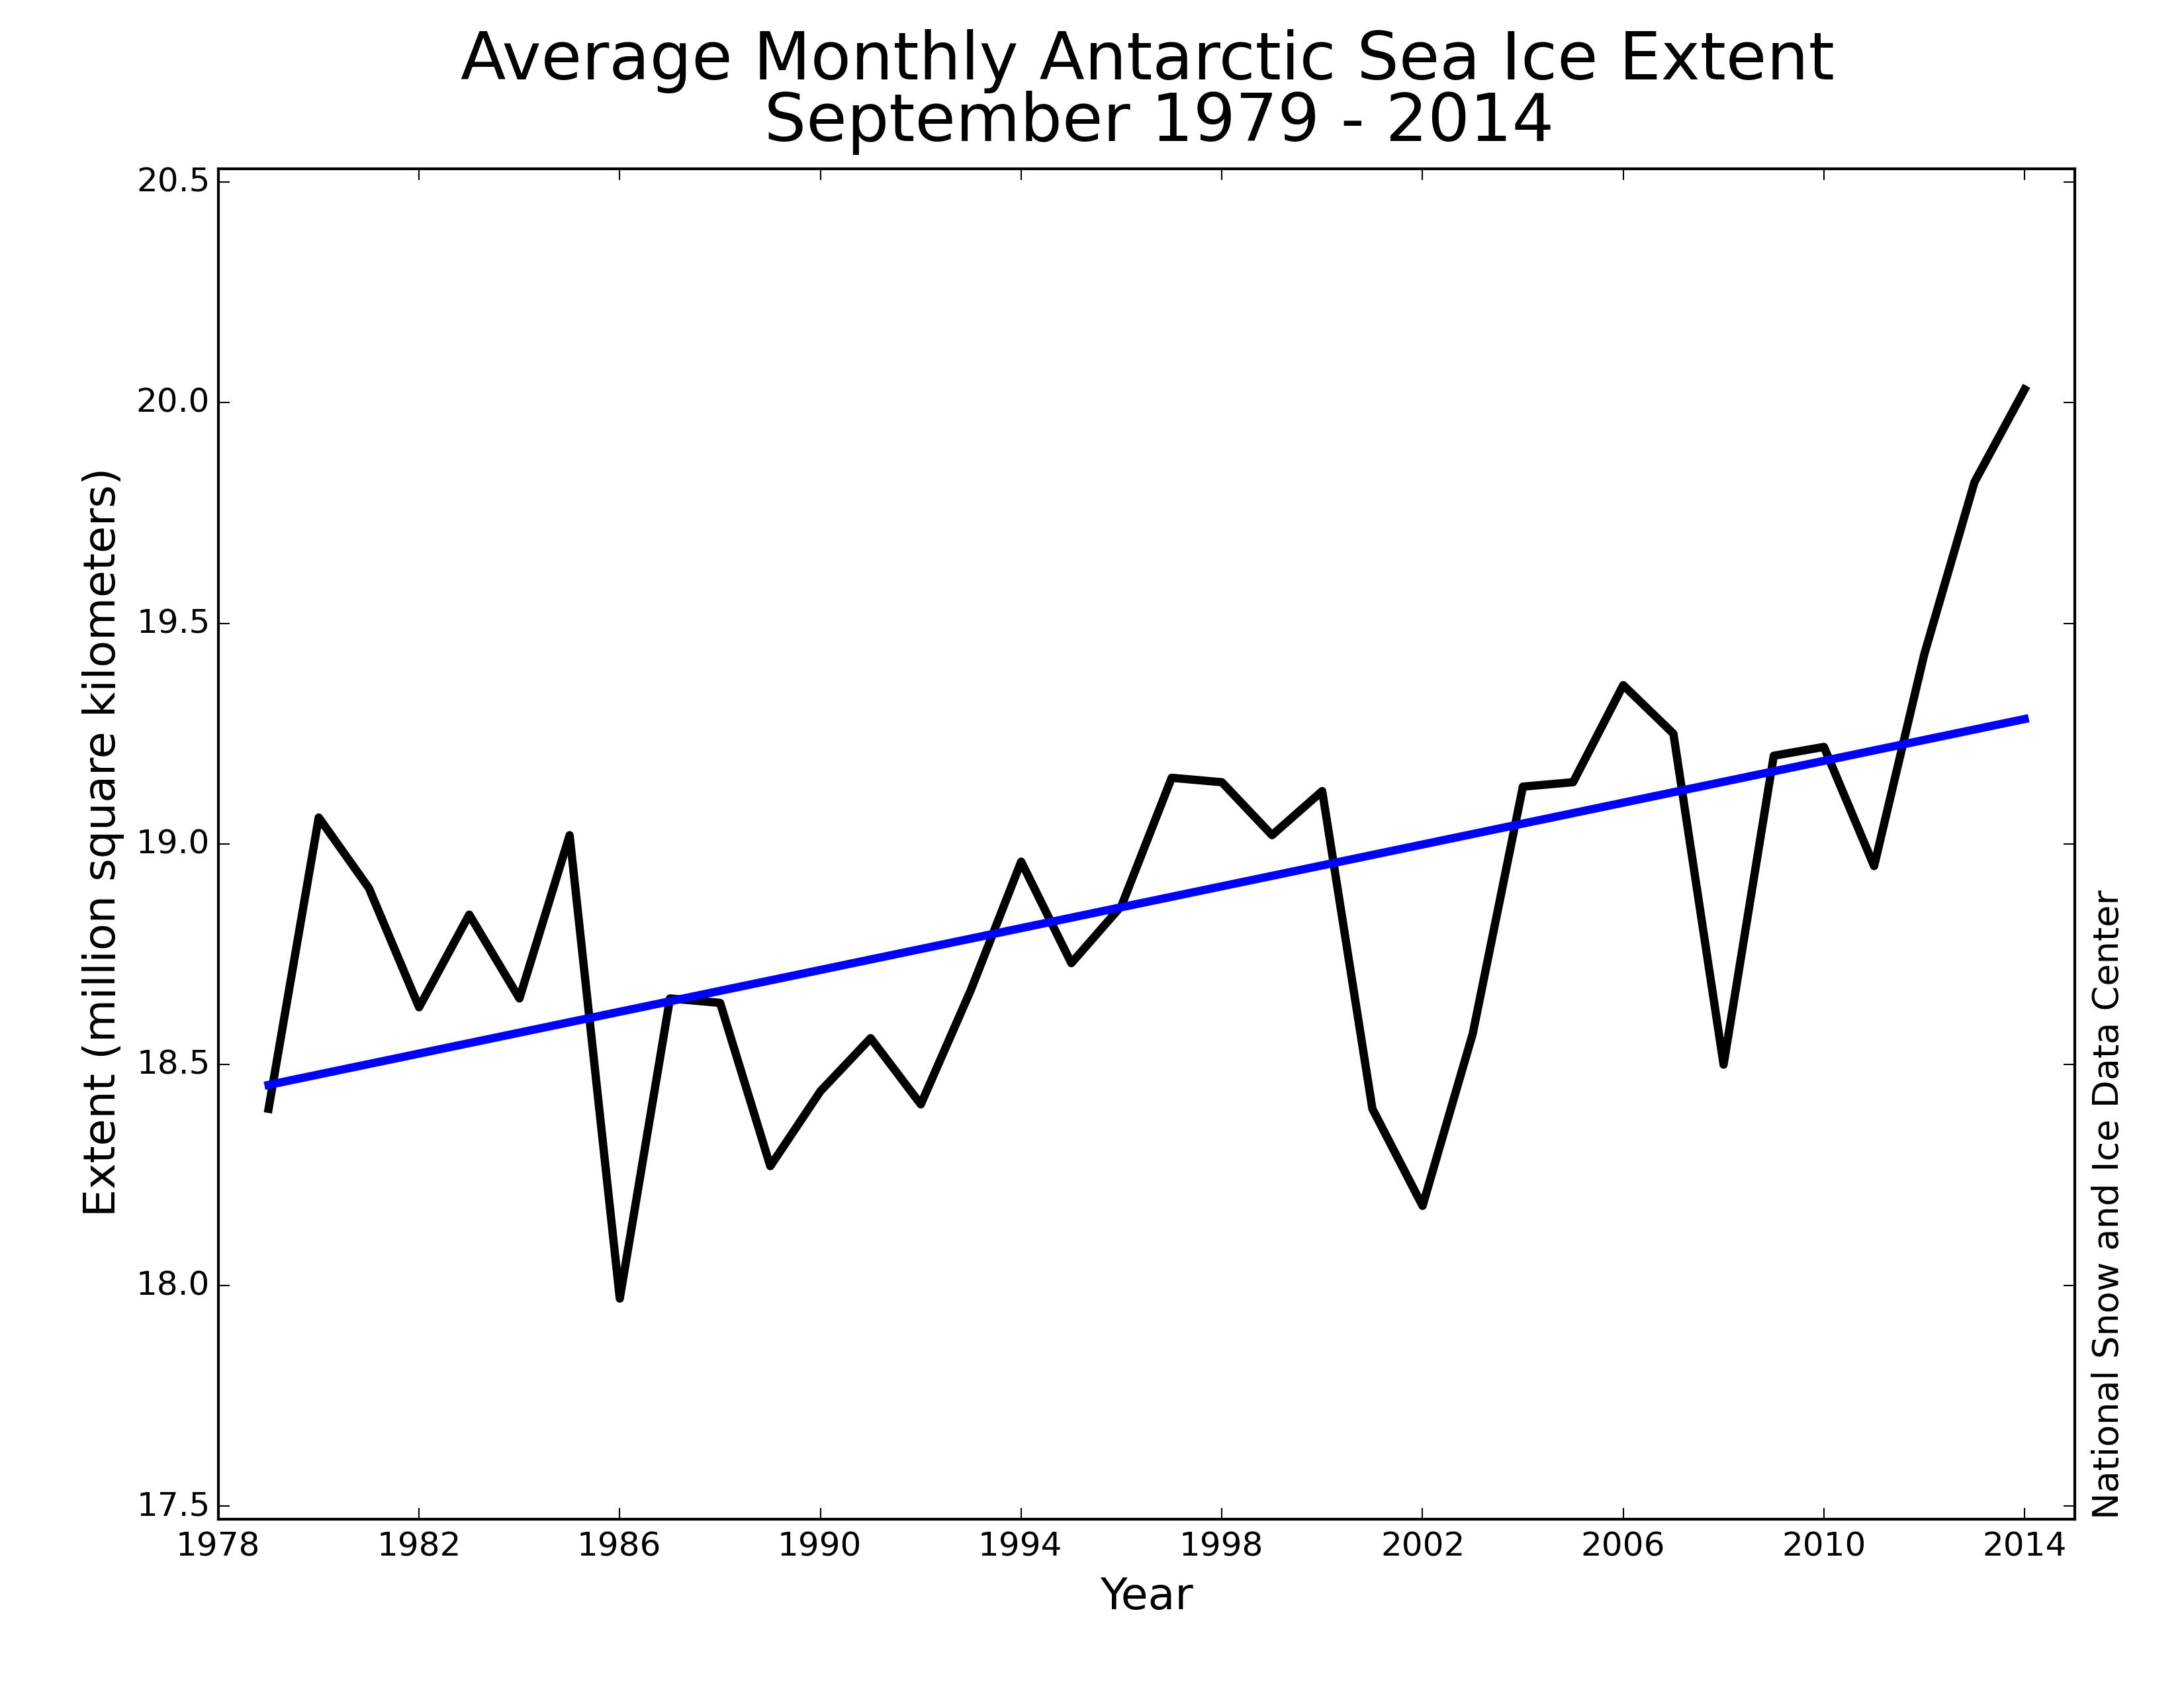
The monthly average Antarctic ice extent for September 2014 is 20.03 million square kilometers (7.73 million square miles). This is 1.24 million square kilometers (479,000 square miles) above the 1981 to 2010 average for September ice extent. The Antarctic sea ice trend for September is now +1.3% per decade relative to the 1981 to 2010 average.
Monthly averaged ice extent for September is well above average in the western Pacific (northern Ross Sea) and Indian Ocean (Enderby Land) sectors.
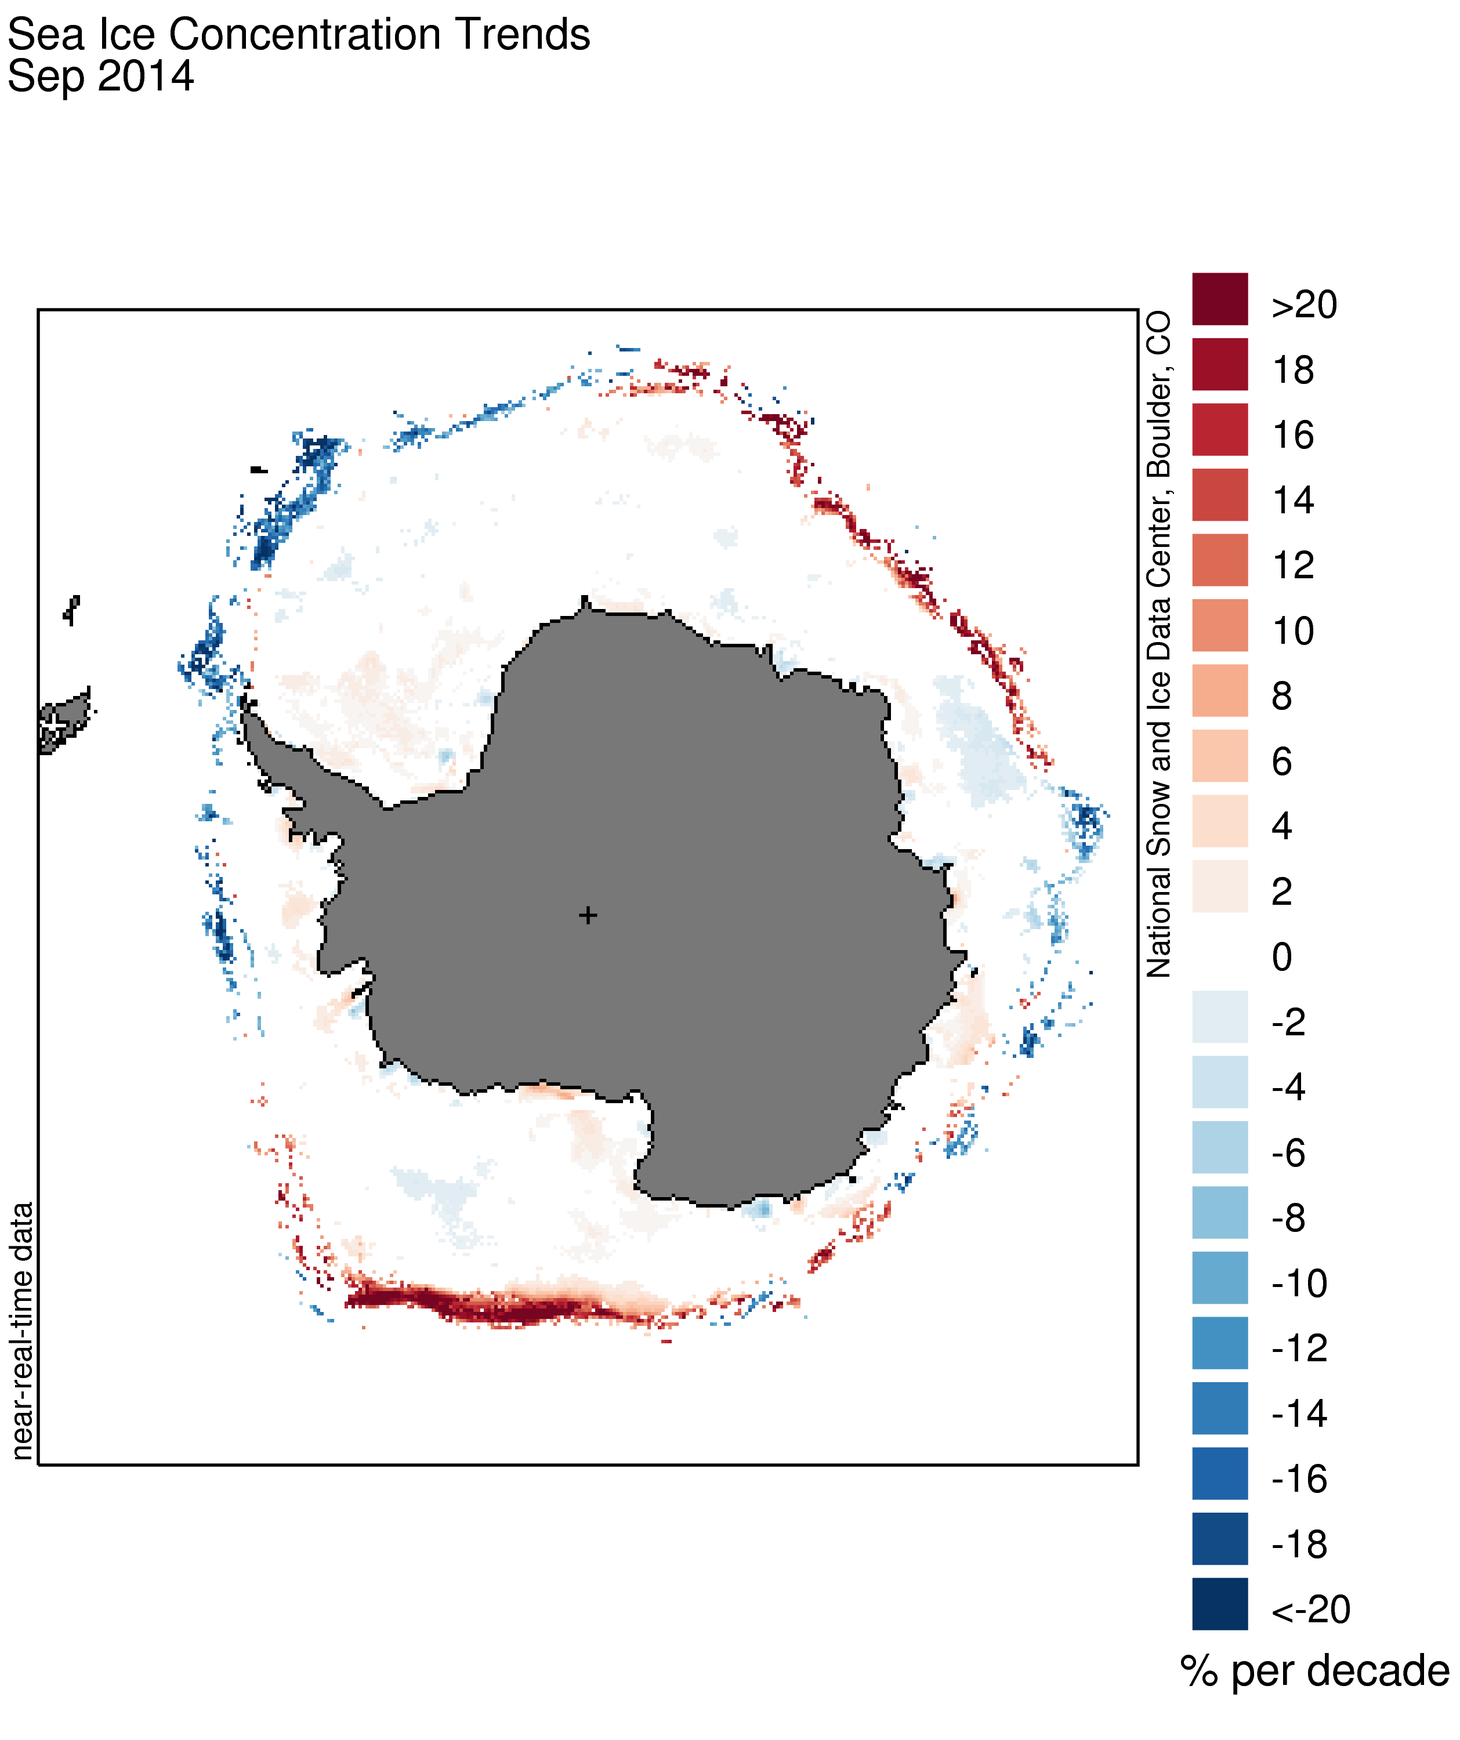
A comparison of ice extent (Figure 6a) with ice concentration trends (Figure 7) illustrates that the areas of unusual ice growth are in the same places that have been showing ongoing trends of increased ice extent. This suggests that wind patterns play a significant role in the recent rapid growth in Antarctic ice extent. However, another possible reason is that recent ice sheet melt, caused by warmer, deep ocean water reaching the coastline and melting deeper ice, is making the surface water slightly less dense. While the change in saltiness is too small to significantly affect the freezing temperature, the increase in slightly less dense water surrounding Antarctica inhibits mixing, creating conditions that favor ice growth (as we discussed in our July 17 post).
The period between September 10 and September 22 saw very rapid late-season ice growth in Antarctica, pushing the total sea ice extent upward by nearly 60,000 square kilometers per day (23,000 square miles). An animation of Antarctic sea ice concentrations from AMSR2 satellite data shows that a pulse of increased sea ice growth in several areas, but especially in the northern Weddell Sea, was the cause of the rapid rise in extent. A look at the weather for mid-September in the south indicates that a band of southerly winds swept from west to east across the northern Weddell Sea, favoring both ice growth and ice advection to the north.
For the mid-winter period, climate patterns for 2014 evolved in a similar way to 2013, as discussed in previous posts and in a paper led by our colleague, Phillip Reid. Sea ice growth in the Ross, Amundsen, and Bellingshausen seas for the austral winter of 2014 was favored by moderately strong low pressure anomalies in the Amundsen Sea, the northern Weddell Sea, and the central Indian Ocean region in mid-winter (late July and August). But at the period of the sea ice maximum, higher pressures over the continent reduced the intensity of westerly winds, and resulted in cooler southerly winds over the Weddell Sea and the Amundsen Sea. This helped to create the very large ice extent values seen in September. The Antarctic sea ice maximum period, as described above, had a further push from southerly winds over the far southern Atlantic (northernmost Weddell Sea) and Indian Ocean regions.
A related note
Last year, a vessel became trapped in ice south of Australia in an incident that highlighted the need for better local ice forecasts. The International Ice Charting Working Group will meet later this month in Punta Arenas, Chile. Members will work on improving the collective capability of ice services to provide ice information in the interests of marine safety.
Reference
Reid, P., S. Stammerjohn, R. Massom, T. Scambos, and J. Lieser. 2015, in press. The record 2013 Southern Hemisphere sea-ice extent maximum. Annals of Glaciology 56 (69), doi:10.3189/2015AoG69A892.
By Dr. Alvin Simms & Jamie Ward
Department of Geography, Faculty of Arts, Memorial University
Declining population growth is not a new trend in this province. In fact, from 1951 to 2001, this province saw significant slowdowns in population growth, and even population decline in the 1990s during the early days of the Cod Moratorium, which saw much of the province’s young workforce leave to look for work in places like Alberta and Ontario.
Pair this mass exodus of young workers with the duel phenomena of aging post-War baby boomers and declining birthrates—two things that plague most Western countries—and the population pyramid of the province has become inverted.
But now, 22 years after the Moratorium, the economic tides of the province have turned, and Newfoundland & Labrador is experiencing a period of unprecedented economic prosperity, and for the first time in over 60 years, population growth.
This growth, however, is small (just 1.8 per cent from 2006-2011), and is certainly not consistent across the province. In rural Newfoundland & Labrador, the story of population decline remains much the same, with some regions’ populations shrinking by 15 per cent from 2006 to 2011, while the population of the Northeast Avalon—St. John’s and surrounding areas—grew by more than 10 per cent over the same time. This shift is creating a very different province than the one founded upon the vitality of remote fishing villages and a rural way of life. Currently, approximately 80 per cent of the population of the province lives within an hour of the Trans-Canada Highway.
“The challenge now is managing economic growth, supporting innovation, and diversification so the growth of the province can be sustained over time and no one gets left behind.”
This increased urbanization brings with it two sets of additional challenges. For urban areas like the Northeast Avalon, and other areas benefiting from the economic boom, there is more crime, more traffic, less affordable housing, and so on. For rural parts of the province that do not have access to the benefits of the drivers of our newfound prosperity— offshore oil, mining, and energy mega-projects—it is a struggle to attract the industry and employment needed to keep young families from leaving, and to provide access to services to an aging population.
The challenge now is managing economic growth, supporting innovation, and diversification so the growth of the province can be sustained over time and no one gets left behind. If there is one thing we can learn from our history, it is that dependence upon one or few industries is a recipe for uncertainty. As a large proportion of the people and wealth of the province gravitate towards urban centres, it would be very easy for the rural way of life to be left behind, but with regional collaboration and innovation, this does not have to be the case. The challenge for rural communities across the province now is to look to their neighbours, build upon their collective strengths, and work together to build strong, economically diverse regions—it’s not about getting bigger, it’s about getting together.
A nation that is endowed with huge population needs to be more focused than those with small population.Today, “the world has about 7.2 billion people, with Africa being the second most populous continent with a population of 1.111 billion or 15 percent of the world’s population”. Currently, Nigeria is estimated to have a population of about 175 million people which is 15.75 percent of Africa’s population. That is, one out of every five Africans is a Nigerian.By the year 2050, “Nigeria’s population is predicted to hit 400 million, while that of the world would be about 10.9 billion”. That is, Nigeria would be expected to have a population that is about 3.67 percent of the world. Could this then be true as we are dealing with projected figures? Although, UN projections show a continued increase in population in the near future with a steady decline in growth rate, Nigeria has a responsibility to start thinking about the consequences of a large population. According to a UN report, “the nation’s environment cannot keep pace with a population rising at the rate of 2.47 percent annually”.A source of concern about this projected figures is that employment, infrastructure, social amenities, housing and health facilities are not growing at the same rate. This perhaps may be due to inadequate resources available at the nation’s disposal.
David Landes in his book titled ‘The Wealth and Poverty of Nations’ theorized that we live in a world of inequality and diversity where the world is divided along three broad categories namely: “those that spend lots of money to keep their weight down; those whose people eat to live; and those whose people do not know where the next meal is coming from”. We are endowed with these categories of people in Nigeria. Importantly, the theory of evolution which posits that the strongest survives whilst the weakest goes into extinction is of relevance in this treatise. This is because Nigeria like other developing countries is a “dual economy” in which a group of people are rich while others are poor but both being united by a common way of life. Both ways of life exist side-by-side such that what the rich spends daily is equal or more than what the hardest working member of the other gets in a month. The factor of unity is the market that both the poor and the rich in the society patronize to purchase goods and services.
Population growth does not give rise to development in any nation if it is not well managed. An unmanaged population growth will in most cases give rise to two world-wide concerns namely: mass unemployment and mass migration to cities.World Bank statistics reflects that unemployment in Nigeria is 38 percent, which by estimation is high. We can see this in Nigeria currently where those in search of jobs are migrating to cities such as Lagos, Port Harcourt, and Abuja. This is what usually happens in a “dual economy” such as Nigeria where about 15 percent of the population are confined to one or two big cities, while the remaining 85 percent are either in rural areas or small towns. On the contrary, the dual economy unless cautiously countered produces what is referred to by Fitzgerald Schumacher as “mutual poisoning” in which industrial development in cities destroy the economic structure in rural areas. Consequently, rural areas payback through mass migration into cities, harming them and making them unmanageable. The cities are therefore congested, infrastructure overstretched with increased crime rate.
Development of any nation according to Fitzgerald Schumacher “does not start with goods and services,it starts with people and their education, organization, and discipline”. Without these three, all resources remain latent, untapped and potential. That is why, we have cocoa but value is added to it in another country to produce chocolates in different forms.These chocolates are imported back to the country. Let us not be deceived to believing that a population growth per annum of more than 2 percent will give rise to economic growth. Some may argue that when the size of population is huge it is good for the economy as it reflects large market. Large market however, does not necessarily correspond with large population but the purchasing power of the people in the society in question. I think this argument is quite illuminating for some Nigerians who erroneously believe that population coincides with the size of market, and thus a sign of development.
The prime causes of underdevelopment and poverty are deficiencies in education, organization and discipline. If we decide as a nation to use agriculture as the basis for the development of our rural areas, then basic infrastructure must be extended to those living in those areas of the country.Can we sustain implementation of the agricultural transformation agenda to develop rural areas, and not only to provide food and employment for the jobless? If the answer is affirmative, then the agricultural transformation agenda will be beneficial to the nation in terms of development.We therefore have a collective responsibility to ensure that the agricultural transformation agenda works.
If we do not want population growth to be an impediment to development, we have to start educating as well as admonishing people to have the number of children they can feed, clothe and educate. There will be no development in having so many children that cannot be adequately catered for by parents and ultimately the government. It was in those days that families chose to be large to enable them manage farms or fight tribal wars. Today’s war is that of economic survival. As policy makers are busy shopping for foreign and local investors, as well as provide electricity, they must also be considering ways of ensuring that necessary steps are taken by individuals, and families to maintain a manageable family size.
M.A. Johnson
|
Ad350% + Investment Returns – private-client-investments.com – High Yield Recession Proof Products -Minimal Risk- Special Tax Credits!
|
Dollars and sense
Dear friend, The divestment campaign is working but we need your help to keep up the pressure… A few weeks ago, Sydney Uni announced a freeze on fossil fuel investments. Last week, ANU announced it’s divesting from gas company Santos and oil company Oil Search. On Monday, the Anglican Diocese of Perth announced it will divest. And today, $8bn super fund Local Government Super announced they’re divesting from coal.[1] Click here to join the movement of individuals and institutions moving their money out of fossil fuels by attending Divestment Day on October 18! It’s clear that momentum for divestment is building – which is why the Australian Financial Review today published this graphic.[2] Click on the image to spread the word on facebook. And this momentum is exactly why the fossil fuel industry is so angry. In the past fortnight, an alliance of industry heavyweights has begun lobbying institutions to hold tight to their fossil fuel investments. On Monday, Australia’s coal lobby released yet another expensive report claiming that divestment will hurt your returns and the world’s poor.[3] But the divestment movement has both dollars and sense on its side. We know that divestment has a negligible impact upon returns. But more importantly, we know that divestment has the power to break the fossil fuel industry’s stranglehold over our leaders so that we can finally get real climate action and the solutions needed to build a more just world. That’s why hundreds of institutions and thousands of individuals around the world are moving their money out of fossil fuels. Click here to join them by divesting with us on October 18! Divestment has the power to take away fossil fuel industry’s social license to pollute the planet. It has the power to set us on a path to a just and sustainable future. But we need you to help make this real… Yours for a brighter future, Charlie PS LIKE and SHARE the Divestment Day facebook event to invite others to join you on October 18. — [1] While coal divestment is great, Local Government Super (LGS) now plans to invest in nuclear! Click here to congratulate LGS on divesting from coal and remind them that nuclear isn’t the answer to the climate crisis. [2] Ben Potter, “ANU Divestment List Sparks Outrage”, Australian Financial Review, 7th October 2014. [3] Jacob Greber, “Fossil fuel champions ‘ethical’ label”, Australian Financial Review, 6th October 2014.
350.org is building a global climate movement. |
|||||||||||