Author: Neville

  • The IPCC report: busting the climate myths

    The IPCC report: busting the climate myths

    Updated Mon 30 Sep 2013, 7:02am AEST

    The release of the IPCC Fifth Assessment Report provides details that stamp out the myths and distortions of those trying to discredit climate science. Has the Earth stopped warming over the past 15 years? The answer is an emphatic no, writes Will Steffen.

    The highly anticipated IPCC Fifth Assessment Report has generated much media interest. A good deal of this, however, has consisted of earlier media reports and articles that broke the embargo on the release of any information from the draft IPCC report.

    Such media efforts, based on leaked versions of the IPCC draft, were often aimed at distorting, misrepresenting or undermining the IPCC’s assessment. This type of media coverage frequently states or infers that the warming of the Earth has stopped and thus action on climate change can be slowed or de-prioritised.

    This isn’t the first time we’ve seen such behaviour. The appearance of the “Climategate” hacked emails in advance of the 2009 Copenhagen climate conference was designed to discredit the mainstream climate science community and hijack the narrative on climate science. So seeding doubt and promulgating misleading science is nothing new.

    Now that the IPCC report has been finalised and released, we can analyse, based on the actual substance of the report, these earlier myths and misleading claims.

    So has the Earth stopped warming over the past 15 years? The answer, based on the reputable science contained in the IPCC report, is an emphatic NO!

    Here are the facts:

    The Earth has warmed significantly over the last century, and particularly strongly since 1970 up to the present. The global average air temperature has risen by 0.89 degrees Celsius over the 1901-2012 period, and the decade 2001-2010 was the warmest on record.

    But global average air temperature is only a very small part of the warming story, as the atmosphere absorbs only 3 per cent of the additional heat trapped by the increasing concentration of greenhouse gases. By far the biggest player in the climate system is the ocean.

    Over 90 per cent of the warming since the mid-20th century has occurred in the ocean, and the heat content of the ocean has risen steadily since about 1970 with no pause or slowing of the rate over the past 15 years. That is really the “smoking gun” of warming. But there is even more evidence of a strongly warming Earth.

    The ice cover over the Arctic Ocean is decreasing rapidly, at a rate of about 4 per cent per decade since 1979. Such rapid ice loss is unprecedented in the last 2,000 years.

    Sea level has risen by 19 cm over the 1900-2010 period. This observed rate of rise over the past century is unusually high in the context of the last 2,000 years.

    Glaciers and ice sheets around the world are shrinking and losing mass. The combined rate of mass loss from the large polar ice sheets on Greenland and Antarctica was about 350 billion tonnes per year for the period 2002-2011, and is accelerating.

    It is even more telling that the rate of sea-level rise, the rate of decrease of Arctic sea ice extent, and the rate of mass loss from Greenland and Antarctica have all increased in the period from the 1990s to the present, compared to earlier periods. This is exactly the opposite of what one would expect if warming of the Earth is slowing or has stopped.

    All of this evidence points to the continued strong warming of the Earth since the mid-20th century up to the present, in stark contrast to the erroneous reports purported to be based on leaked drafts of the IPCC assessment.

    A second example of distortion and misrepresentation is the claim that, according to the IPCC, the climate is less sensitive to increases in greenhouse gas concentrations in the atmosphere than was earlier thought. The IPCC has said no such thing. Here are the facts:

    The range of estimated climate sensitivity in the Fifth Assessment Report, 1.5-4.5C per doubling of atmospheric carbon dioxide concentration, is slightly larger than that reported in the 2007 report (2.0-4.5C). The 0.5C decrease in the lower end of the range reflects estimates using the records of atmosphere and ocean temperature change in the contemporary period.

    Estimates of climate sensitivity using climate model simulations and observational records from past climate changes (for example, the transition of the Earth from the last ice age to the present warm period) give estimates towards the mid and upper end of the range, while methods based on contemporary observations give estimates towards the lower end of the range. The IPCC gives no estimate of a “most likely” value of climate sensitivity.

    In summary, there has been no significant change in our estimate of climate sensitivity since the publication of the IPCC Fourth Assessment Report in 2007.

    So much for the myths and distortions of those trying to discredit climate science. What actually are the key messages of the IPCC Fifth Assessment Report?

    1. There is stronger evidence that the Earth’s climate is warming – rising air and ocean temperature, loss of mass from glaciers and ice sheets, and rising sea level.
    2. Scientists are more certain than ever that most of the warming since 1950 has been caused by human activities, primarily the emission of carbon dioxide from fossil fuel combustion.
    3. A warming climate is influencing the frequency and severity of many extreme weather events and is changing rainfall patterns, creating risks for human well-being, the economy and the environment.
    4. Stabilising the climate system will require substantial and sustained reductions of carbon dioxide emissions, and those of other greenhouse gases.

    As the Climate Commission, and now the Climate Council, often say – this is the critical decade to get on with the job of reducing emissions quickly and deeply.

    Professor Will Steffen is executive director of the ANU Climate Change Institute and a member of the Australian Climate

  • Climate change study finds Australia suffers more than most G20 countries

    Climate change study finds Australia suffers more than most G20 countries

    Exposure worsens rapidly, with stresses on water increasing and the cost of natural disasters running second only to China

    Cyclone

    Cyclone damage in Queensland, where Bundaberg flooded in February. Photograph: Sabrina Lauriston/AAP

    Australia‘s exposure to climate change has worsened more rapidly than in any other major economy in the past two years, with stresses on water supplies increasing and the cost of natural disasters running second only to China, a report has found.

    The study, compiled by HSBC, found that temperatures in Australia had risen faster than in any other G20 country over the past two years – up by 0.39C to 18.9C on a decade average basis. Deterioration in water resources is also a major issue, with Australia, along with Saudi Arabia, experiencing the worst increases.

    HSBC concluded that India, China, Indonesia, South Africa and Brazil are the countries most vulnerable to climate change, based on the challenges posed by climate change and their ability to respond to them.

    However, Australia’s position appears to be worsening, with the country now placed as the fifth worst in the G20 for climate change exposure, down five places from HSBC’s last climate report in 2011. This separate ranking is based on a country’s exposure to temperature increases, water stresses and extreme events.

    HSBC said that this downgrading was largely due to Australia’s G20-leading temperature increase, although it is clear that water stresses and natural disasters have also taken their toll.

    Australia’s water resources per capita have dropped 6.8% in the past two years, according to the report. Meanwhile, Australia spends 0.24% of GDP on recovery from disasters caused by natural events such as floods and cyclones, second only to China (0.30%).

    According to the report, damage caused by natural disasters hit $US260bn in the decade to 2012.

    On Friday, the International Climate Change Partnership’s authoritative climate change report revealed that Australia was on course for a 6C temperature increase on its warmest days by 2100. Australia can also expect to lose many bird, reptile and mammal species, as well as the Kakadu wetlands in the Northern Territory.

    Nathan Fabian, CEO of the Investor Group on Climate Change, told Guardian Australia that climate change posed a significant economic challenge to Australia.

    “The transition to a clean energy economy is a major issue for Australia as it is way too emissions intensive than it should be,” he said. “This provides a high degree of economic exposure.

    “Our research has also shown that key sectors which Australia invests in, such as mining and minerals, manufacturing and transport, all have significant physical vulnerabilities which we expect to be more severe by 2030.

    “That means businesses have to build resilience within assets and adapt by relocation if possible. It’s a critical issue for Australian companies and it’s starting to filter into conversations in boardrooms.”

    Daily email

    close

    Get the Guardian’s daily Australia email

    Our editors’ picks for the day’s top news and commentary delivered to your inbox every weekday.

    Sign up for the daily email

    • Get £11 off the Guardian and Observer  
      Sign up now and instantly receive vouchers for £11 off the Guardian and Observer papers. Redeemable for today’s paper and every paper for two weeks.
      Get your voucher

    Today’s best video

    Guardian Bookshop

  • Climate battle line: Community mobilisation or Canberra lobby?

    30 September 2013

    Climate battle line: Community mobilisation or Canberra lobby?

    by David Spratt

    Rally against carbon pricing, Canberra, 23 March 2011

    How should climate activist and climate campaigning organisations respond to the new Abbott government, and its goal of knocking out most of Australia’s climate programmes and trashing environmental regulation in the service of the fossil fuel and mining industries?

    • Should the methods utilised for the Labor and Labor–Greens coalition governments, of applying pressure and trying to negotiate better outcomes, be used?
    • Or should we set out to deliberately get the Abbott government out of office?

    The Abbott Liberal–National Party government celebrated its victory by abolishing Australia’s Climate Commission, the first baby steps in a culture war on climate programmes, the renewable energy industry and environmental regulation and protection.

    View or
    download
    as PDF

    The Abbott government’s goal is to to facilitate the rapid expansion of the fossil fuel sector, including a gem from the new energy minister that he will ensure that “every molecule of gas that can come out of the ground does so”, by:

    • removing regulatory and tax imposts on the fossil fuel industry;
    • moving to diminish the effectiveness of the environment, climate action and anti-fossil-fuel-industry movements; and
    • inhibiting the growth of the renewable energy sector.

    This is a monumental climate battle, a broad social polarisation between two conflicting sets of values, principally on the relationship between science and ideology, the role of government, the relationship between humans and nature, and the future of the fossil fuel industry and of society’s technological path.

    The Abbott government’s climate policy may be described as Deny–Delay–Deregulate, and is founded on:

    • conservatism and the preservation of the status quo against change: a desire to hold back the sea in the service of the fossil fuel industry, even while recognising that a huge economic–technological tide of change is closing in;
    • a commitment to neo-liberal, deregulatory economic policy: defence of free-market capitalism against higher levels of state intervention and regulation;
    • an instrumental view of nature as a resource for exploitation;
    • championing the interests of the fossil fuel industries  economy;
    • an anti-scientific stance, which extinguishes the distance between science and ideology and drives a culture war with a religious component against secular science and environmentalism; and
    • the ethos of politics as warfare, the virtues of confrontation and political extremism and the dumbing-down of politics.

    In opposition, Abbott’s tactics in propelling the climate war have included:

    • formal acceptance of climate change as real, but a downplaying of the human role as making only “a contribution”, persistent denial of any link between climate change and impacts including more extreme events, all accompanied by a chorus of denialist rhetoric from his caucus;
    • dumbing-down and politicising climate science, and the exploitation of scientific uncertainty;
    • tarring good climate policies with the brush of Labor’s political incompetence;
    • national chauvinism (along the lines “we will not act to disadvantage Australia while others… “);
    • utilising the politics of resentment to rally Howard’s battlers, the fishers, the shooters and the politically marginalised against the professional class and “inner-city elites”, such as climate scientists, policy-makers, The Greens, environmentalists, rich life-stylers;
    • promoting fear of economic loss, describing the effect of climate action, in Abbott’s words, as “to put at risk our manufacturing industry, to penalise struggling families, to make a tough situation worse for millions of households right around Australia”;
    • ruthlessly exploited the myth of cost of living pressures (as GDP per capita grew strongly), in particular that myth that renewable energy was the main culprit for higher electricity prices.

    1. A titanic struggle

    Before too long, Prime Minister Abbott will have Barnaby Joyce beside him as deputy prime minister and Nationals leader. At heart, both are denialists along with a significant portion of the caucus. Maurice Newman, the former ABC and the ASX chairman who will be the chair of Abbott’s Business Advisory Council, propounds “the myth of anthropological climate change”.

    Abbott’s record includes “the science isn’t settled”, it’s “highly contentious” and “not yet proven”, “it’s cooling”, “it hasn’t warmed since 1998”,  “there’s no correlation between CO2 and temperature”, and he is “hugely unconvinced by the so-called settled science”. Despite what he says, this is what he thinks and it will inform how he will act.

    The Abbott government will not be persuaded by reason and is not interested in compromise because this is a battle to be won, and compromise and negotiation are signs of weakness. For this government, fighting enemies is more important than reality-based policy-making. This is about the politics of resentment, fear and revenge, about winning, and about debilitating the enemy. Culture wars are not primarily about policy detail, but about building legitimacy, isolating the enemy and establishing dominance.  

    2. One big decision

    So what is the strategic response?  In the last term of the Howard government, trade unionism faced similar circumstances with the WorkChoices legislation and made a very clear decision not to give priority to working in Canberra’s halls of power lobbying and prying incremental changes from the government, but to devote all the resources they could muster to bringing down the government. Your Rights at Work was a well-resourced, strategic, unified and persistent campaign encompassing a strong public affairs component, membership mobilisation, and an electoral campaign over 20 marginal seats, each with a full-time organiser and local cooperation between the ACTU affiliates to facilitate systematic community outreach.

    The climate movement, both professional and community-based, faces a similar decision. Is the main strategy to work with the Abbott government, to cajole, negotiate and compromise to improve outcomes, or is the principal task to help it them from power?

    The former Climate Commissioners and the CEFC Board have both shown backbone in eschewing acquiescence, and taking on the government. The reality is that as long as Abbott stays in power, the Australian Government will do next to nothing on climate.

    Some of the big climate and environment organisations are structured for Canberra work, and ill-equipped for sustained, unified, effective community organising, so the instinct will be to continue as before. But this is a serious misreading of Abbott’s modus operandi, and spending large amounts of time trying to incrementally change really bad policy is a misallocation of resources, with a large opportunity cost. This would affirm Naomi Klein’s view that such groups face a systemic crisis.

    3. Non-cooperation: Delegitimise their claim to action

    Tim Flannery terms the next period a “gigantic struggle”. One of our purposes must be to de-legitimise the government’s claim that they are taking effective action against climate change through their Direct Action Plan, by people understanding its manifest inadequacy. It is no certainty that the government’s plans will have an easy or successful passage through the Senate, even after 1 July 2014. All sorts of odd outcomes are possible.

    Much of the climate movement opposed Rudd’s CPRS in 2009 because it was so inadequate, so it would be consistent to oppose Tony Abbott’s scheme also. The failure of the Direct Action legislation would allow an even clearer message that Tony Abbott has no real climate plan.

    If the climate movement works to incrementally improve Direct Action, it will provide the government with a fig-leaf of legitimacy which they will ruthlessly exploit. On the other hand, counterposing a real direct action plan to replace dirty coal power with renewables, and keep CSG and new coal in the ground, would build on existing campaigning and provide many paths to action for the community. It would demonstrate the clear choice between the dirty fossil fuel industry and increasing climate harm on the one hand, and the clean economy and future climate safety on the other.

    The possibility of sacrificing some existing policies to better defend others is a mis-reading of the politics. Every piece of legislation Abbott repeals is his victory. Why make it easy?

    Should we also make this about the opposing climate action views of Tony Abbott and Malcom Turnbull? Should Turnbull’s electorate be hit hard from now till June next year, challenging him to be morally courageous and not to backflip on climate legislation he supports? Tony Abbott made his daughters a political issue, maybe we can too, for example by talking about what sort of hotter world his daughters children will grow up in. Agriculture minister Barnaby Joyce on the fate of the Murray-Darling in a hotter world may be illuminating.

    4. Impacts first: Delegitimise their anti-science stance

    The Abbott government now wants to take boat arrivals and the efficacy of their refugee policy out of the public gaze. The same will be true of climate: their campaign in opposition was principally about Julia Gillard’s legitimacy, and less about the reality of climate change, and they have been neither willing nor capable of dealing with the substance of the climate impact issues.

    The past period where the Labor government (and NGOs to some extent in the “Say Yes” campaign, for example) tried to sell a climate policy without making the story about climate impacts was wrong, wrong, wrong. Brightsiding is a bad strategy. Trying to sell an answer without providing sufficient reason to act doesn’t work. Too many times in the past the climate movement has been reticent to connect the dots between extreme weather and climate change.

    The new Climate Council is but one small step in keeping climate science stories and impacts as public as possible. We can demonstrate the Abbott government’s ignorance and incompetence by hammering them over climate impacts on health, climate extremes, bush fires, food, water, inland Australia and the fate of farmers in and outside parliament every day, every which way. The attempts to silence and de-fund climate science research will likely backfire: on campuses, students can fire up in support of their teachers and against the politicisation of the academy.

    5. People, not Nemo

    A fundamental review of climate communication strategies is urgent. Climate story-telling should be about people, not Nemo. It should be about human values and morality, not economic and business rewards. Framing climate as an environment issue is counter-productive and plays to Abbott’s strength. So does making it a story just about the future, rather than also about now.

    Our story should be principally about people in Australia, not distant places. Our story should be about now: about connecting the dots between extreme events and global warming; about bush fires and extreme heat and suffering communities; a story about how family and friends will live and die in a hotter and more extreme world; a story about how a hotter climate and a retreating coastline will affect where we live and work; a story about health and well-being; about increasing food and water insecurity; and the more difficult life that children and grandchildren will face. This makes climate a values issue, the choice between increasing climate harm and climate safety, between warming caused by dirty fossil fuels and the solution of building a clean economy. [For more discussion see here and here.]

    The stories we tell vary with the audience: whether it be the impact of storm surges and rising sea levels on coastal communities and surf clubs; what more extreme fires means for first-responder workers, or more extreme heat days mean for the health sector; what drying of southern Australia means for farming communities; or how climate impacts will make the overseas aid policy paradigm obsolete.

    Society’s pace of change is creating new fears and insecurities as people struggle to keep up and worry about being left behind. And they fear about the future in which their children will live. Hyper-consumption is driven by insecurity — fear of being left behind, of being “unfashionable” in the broad meaning of the term — and self-entitlement. Sociologist Zygmunt Bauman says that: “Human vulnerability and uncertainty is the foundation of all political power.” Abbott understand the politics of fear, but do we?  Can we construct a  narrative that recognises fear and provide clear path to climate safety, rather than increasing personal and planetary insecurity? How can Howard’s battlers become safe climate champions?

    Doctors and scientists are credible public figures on climate. NGO talking heads fit the stereotype of middle-class, inner-city, professional, green elites making an easy living off climate alarmism. What will bring greater legitimacy to our side? Firefighters, nurses and first-responders of all kinds, surf-life savers, worried grandparents, tradies unable to work due to extreme heat, new parents, farmers forced off the land, retired military, John Hewson and Malcolm Fraser, Ian Dunlop, Cathy McGowan and Ita Buttrose.   

    6. Mobilisation

    The largest, most motivated and effective climate action mobilisation in Australia today focuses on coal and coal seam gas (CSG). Overwhelmingly,  the resources are devoted to the communities, not Canberra lobbying.

    The election campaigns in the seat of Melbourne and Indi championed the power of community organising. Resources such as NationBuilder can be tuned to issue campaigning as easily as candidate electioneering. Your Rights at Work provides valuable insights.

    Walk Against Warming 2006

    In the latter years of the Howard government, and during the first Rudd government, there were powerful expressions of community concern through events such as Walk Against Warming. Sectors including aid organisations, churches, unions, schools and students and grassroots climate groups all participated in a show of solidarity and concern. On the surface, many of those sectors appear to be much quieter now.

    If the strategic choice is to focus on bringing down the government, rather than cooperating in incrementally improving bad policies, then community and sectoral organisation and mobilisation is the key.

    At the scale now required in support of climate action, this has not been previously attempted in Australia.  It will require a lot of working out, cooperation in planning and execution, sustained unity in action, and a lot of resources. It will need a degree of trust, of sharing, and promoting the interests of the whole rather than the imperatives of the part. It will require that the lessons of the Say Yes review be absorbed, not palmed to one side.  It will require all sorts of things that many people say are “not possible” given the structures, relationships, branding imperatives and skill sets of the organisations and networks that should be involved, large and small. It will require a small revolution in how many parts of the climate movement work.

    If that really is “not possible”, then success in the battle is a lot less likely.

    7. “Holding the line” is not enough

    It is not enough just to defend what Abbott wants to destroy.  Climate change is already dangerous, time is very quickly running out if we are to avoid catastrophe. A safe climate is the only reasonable goal, and what it requires must be central to our narrative and actions. It requires, in the first instance, ideas leadership.

    International Energy Agency Chief Economist Fatih Birol calls the 2°C goal “a nice Utopia”, and the prevailing climate policy-making framework now poses a choice between a “dangerous but liveable” 2ºC of warming and the “catastrophe” of 4ºC or more.

    The aims of international climate negotiations and of the global climate action movement are to prevent dangerous climate change. But what do we do if global warming is already dangerous, and that 2°C boundary is itself a disaster?  This is now the case.

    Researchers Kevin Anderson and Alice Bows show that  if global emissions don’t peak till 2020, then the 2°C carbon budget for the developed world is… zero (4).  Even the 2ºC target requires actions that are completely outside the current climate policy-making framework, and therefore considered impossible.

    The UK’s Tyndall Centre says that:

    Today, in 2013, we face an unavoidably radical future. We either continue with rising emissions and reap the radical repercussions of severe climate change, or we acknowledge that we have a choice and pursue radical emission reductions: No longer is there a non-radical option. Moreover, low-carbon supply technologies cannot deliver the necessary rate of emission reductions – they need to be complemented with rapid, deep and early reductions in energy consumption.

    If we don’t establish public ideas leadership around these understandings now, what hope go we have ?


  • 800 of them worked on this. It’s worth knowing about.

    800 of them worked on this. It’s worth knowing about.

    Inbox
    x
    Aaron Packard – 350.org <aaron@350.org>
    5:23 PM (7 minutes ago)

    to me
    Images are not displayed. Display images below – Always display images from aaron@350.org

    Dear friend,

    On Friday the Intergovernmental Panel on Climate Change (the IPCC) released it’s 5th Assessment Report on Climate Change. This report is the most authoritative and comprehensive assessment of scientific knowledge on climate change, prepared by over 800 of the world’s leading experts. Its findings are clear – climate change is real, caused by human activity and needs to be urgently addressed.

    Since we’re quite fond of science and numbers at 350.org — after all, we’re named after the safe level of carbon dioxide in the atmosphere — we wanted to share a few of the key numbers from the new climate report:

    • 95%: that’s the level of certainty that scientists have that humans are causing the world to heat up. To put that into context, that’s the same level of certainty scientists have that cigarettes cause cancer. That’s what scientists call “unequivocal”. The debate on the basics of climate science is over.

    • 1 Trillion: the global “carbon budget” in tonnes. That’s the amount of CO2 we can release into the atmosphere while keeping global warming under 2 degrees Celsius — what many scientists have identified as a red line for our planet. We’ve already burned through about half of that carbon budget.  Translation: we need action. ASAP.

    • 1,2,3: the ranking of the last three decades in the “warmest decades in recorded history.” In other words: the planet is heating up, and we’re breaking new climate records every day.

    But there are a few numbers you should know about climate change that aren’t in the latest report — numbers that give us reason for hope:

    • 100%: that’s the expected growth in global installed solar power over the next two and a half years! That’s a doubling of global solar capacity in a mere 30 months. The renewable energy revolution has begun.

    • 20,000: that’s the number of events, protests, and rallies we’ve organized at 350.org globally. We’ll be adding to that with Summer Heat fast approaching. The movement is everywhere, and it’s active.

    • 100,000: that’s the number of new activists to have joined 350’s global network in the last few months. We’re growing — and fast.

    Unfortunately however, our new Government has stuck its head in the sand. As one of its first moves, Tony Abbott’s Coalition abolished the Climate Commission – Australia’s own version of the IPCC. The Climate Commission provided essential information to the Australian public on climate change, taking the politics out of climate science. And last week, the Government announced plans to introduce legislation that would ban boycotts on products for environmental reasons – preventing consumers from getting the information they need to make informed choices.

    But when the going gets tough, the tough get going. Just days after the Climate Commission was abolished, a new Climate Council was established, and it has been flooded with support from the community. Since Tuesday, thanks to small donations from over 20,000 individuals, almost $1 million has been raised. If you haven’t already chipped in, you can do so here. This is the power of community. And when it comes to the Coalition’s proposed anti-boycott amendments, we’ll stand up again to protect our consumer rights.

    The IPCC report lays out the challenge we’re facing. It’s now up to us to do what’s needed to meet that challenge. We can do it, but only if we keep up the fight. Check out our recently updated website: 350.org.au to see how you can join us.

    Keep up your courageous work!

    Aaron, Simon, Blair, Charlie and all the 350.org Australia team

    PS – check out this great graphic about the new report — can you take a moment to share it on Facebook? Or simply pass this email on?


    More Info and Resources 

    U.N. Climate Panel Endorses Ceiling on Global Emissions – The New York Times

    What 95% certainty of warming means to scientists – AP Article

    IPCC climate report: human impact is ‘unequivocal’ –  The Guardian

    Chart: 2/3rds of Global Solar PV Has Been Installed in the Last 2.5 Years – GreenTech

    Climate Change 2013: The Physical Science Basis – IPCC

  • How America Will Age Over the Next 30 Years

    How America Will Age Over the Next 30 Years

    By Morgan Housel | More Articles
    September 28, 2013 | Comments (2)

    Earlier this week, I wrote about the prospects of a new baby boom.

    The data behind the forecast is persuasive, in my view. Very few people saw the baby boom of the 1950s coming. Few will see the next demographic shift coming.

    But what if the baby boom forecast is wrong? That’s entirely possible.

    The current forecast among demographers is that America’s population will age for the next many decades. Our total population will still rise — and importantly, our working-age population will keep marching higher, too — but the average age of America’s total population is projected to rise over the years.

    Let’s look at the numbers.

    Ignoring immigration, population growth is a function of two forces:

    • A birth rate of more than two children per female
    • A declining mortality rate (rising life expectancy)

    For most of modern U.S. history, population growth was propelled by the former. From 1980 to 2012, fully 70% of U.S. population growth came from those under the age of 50.

    But things changed. The birth rate fell, and life expectancy is rising. If the baby boom story is wrong, and that trend continues, as the Census Bureau currently projects, population growth in the coming decades will be driven by growing numbers of older Americans.

    Here’s a simple way to show the shift, using the Census Bureau’s population forecast:

    Period Total Population Growth Growth, Age 60 & Under Growth, Age 60+ Share of Total Population Growth, Age 60+
    1980-2012 86 million 62 million 24 million 27%
    2012-2040 80 million 39 million 41 million 51%

    Breaking it down further:

    Period Population Growth,
    Age 20-50
    Population Growth,
    Age 70+
    1980-2012 31 million 12 million
    2012-2040 20 million 33 million

    This is tremendously simplified, but if you buy these forecasts, one takeaway might be this:

    • During the last three decades, the most growth was found in industries catering to young households — consumer goods, construction, education, and entertainment.
    • During the next three decades, most of the growth might be in industries catering to older groups — health care, retirement services, planning, and leisure.

    For more on how demographics impact the economy, check out:


    More on economics 
    The Motley Fool’s new free report, “Everything You Need to Know About the National Debt,” walks you through with step-by-step explanations about how the government spends your money, where it gets tax revenue from, the future of spending, and what a $16 trillion debt means for our future. Click here to read the full report!

    The End of the “Made-In-China” Era
    The 21st century industrial revolution has already begun. Business Insider calls it “the next trillion dollar industry”. A new investment video reveals the impossible (but real) technology that could make you impossibly rich. Simply enter your email address below to see the surprise ending:


    The End of the “Made-In-China” Era

    The 21st century industrial revolution has already begun. Business Insider calls it “the next trillion dollar industry”. A new investment video reveals the impossible (but real) technology that could make you impossibly rich.

    Click here to see the surprise ending

    Read/Post Comments (2) | Recommend This Article (2)

  • IPCC summary report at a glance, in their own words

    1 of 41
    Why this ad?
    Discover the NBNwww.commander.com – We’ll keep you up to date when NBN will be coming to your area!

    Fw: climate code red

    Inbox
    x
    NEVILLE GILLMORE
    11:13 AM (0 minutes ago)

    to me
    —– Forwarded Message —–
    From: Climate Code Red <noreply@blogger.com>
    To: ngarthurslea@yahoo.com.au
    Sent: Saturday, 28 September 2013 6:34 PM
    Subject: climate code red


    climate code red


    Posted: 27 Sep 2013 10:49 PM PDT
    via Climate News Network

    RELATED STORIES

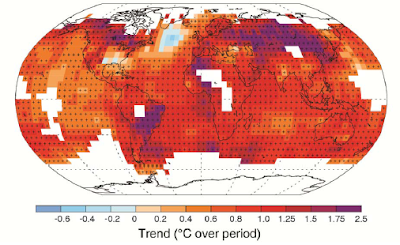
    Observed changes in average surface temperature 1901-2012

    Summary for Policymakers of the Working Group I contribution to the Fifth Assessment Report

    A note from the Climate News Network editors: we have prepared this very abbreviated version of the first instalment of the IPCC’s Fifth Assessment Report (AR5) to serve as an objective guide to some of the headline issues it covers. It is in no sense an evaluation of what the Summary says: the wording is that of the IPCC authors themselves, except for a few cases where we have added headings. The AR5 uses a different basis as input to models from that used in its 2007 predecessor, AR4: instead of emissions scenarios, it speaks of RCPs, representative concentration pathways. So it is not possible everywhere to make a direct comparison between AR4 and AR5, though the text does so in some cases, and at the end we provide a very short list of the two reports’ conclusions on several key issues. The language of science can be complex. What follows is the IPCC scientists’ language. In the following days and weeks we will be reporting in more detail on some of their findings.

    In this Summary for Policymakers, the following summary terms are used to describe the available evidence: limited, medium, or robust; and for the degree of agreement: low, medium, or high. A level of confidence is expressed using five qualifiers: very low, low, medium, high, and very high, and typeset in italics, e.g., medium confidence. For a given evidence and agreement statement, different confidence levels can be assigned, but increasing levels of evidence and degrees of agreement are correlated with increasing confidence. In this Summary the following terms have been used to indicate the assessed likelihood of an outcome or a result: virtually certain 99–100% probability, very likely 90–100%, likely 66–100%, about as likely as not 33–66%, unlikely 0–33%, very unlikely 0–10%, exceptionally unlikely 0–1%. Additional terms (extremely likely: 95–100%, more likely than not >50–100%, and extremely unlikely 0–5%) may also be used when appropriate.

    Observed Changes in the Climate System

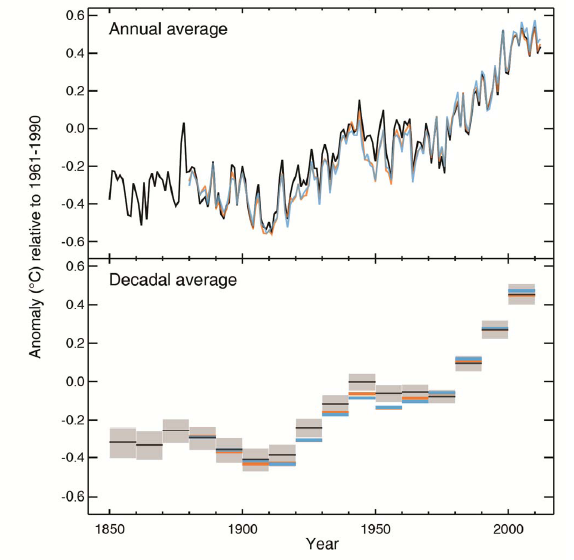
    Observed globally averaged combined land and
    ocean surface temperature anomaly 1850-2012

    Atmosphere

    Warming of the climate system is unequivocal, and since the 1950s, many of the observed changes are unprecedented over decades to millennia. The atmosphere and ocean have warmed, the amounts of snow and ice have diminished, sea level has risen, and the concentrations of greenhouse gases have increased

    Each of the last three decades has been successively warmer at the Earth’s surface than any preceding decade since 1850.

    For the longest period when calculation of regional trends is sufficiently complete (1901–2012), almost the entire globe has experienced surface warming.

    In addition to robust multi-decadal warming, global mean surface temperature exhibits substantial decadal and interannual variability. Due to natural variability, trends based on short records are very sensitive to the beginning and end dates and do not in general reflect long-term climate trends.

    As one example, the rate of warming over the past 15 years, which begins with a strong El Niño, is smaller than the rate calculated since 1951.

    Changes in many extreme weather and climate events have been observed since about 1950. It is very likely that the number of cold days and nights has decreased and the number of warm days and nights has increased on the global scale.

    Ocean

    Ocean warming dominates the increase in energy stored in the climate system, accounting for more than 90% of the energy accumulated between 1971 and 2010 (high confidence ). It is virtually certain that the upper ocean (0−700 m) warmed from 1971 to 2010, and it likely warmed between the 1870s and 1971.

    On a global scale, the ocean warming is largest near the surface, and the upper 75 m warmed by 0.11 [0.09 to 0.13] °C per decade over the period 1971–2010. Since AR4, instrumental biases in upper-ocean temperature records have been identified and reduced, enhancing confidence in the assessment of change.

    It is likely that the ocean warmed between 700 and 2000 m from 1957 to 2009. Sufficient observations are available for the period 1992 to 2005 for a global assessment of temperature change below 2000 m. There were likely no significant observed temperature trends between 2000 and 3000 m for this period. It is likely that the ocean warmed from 3000 m to the bottom for this period, with the largest warming observed in the Southern Ocean.

    More than 60% of the net energy increase in the climate system is stored in the upper ocean (0–700 m) during the relatively well-sampled 40-year period from 1971 to 2010, and about 30% is stored in the ocean below 700 m. The increase in upper ocean heat content during this time period estimated from a linear trend is likely.

    Cryosphere

    Over the last two decades, the Greenland and Antarctic ice sheets have been losing mass, glaciers have continued to shrink almost worldwide, and Arctic sea ice and Northern Hemisphere spring snow cover have continued to decrease in extent (high confidence).

    The average rate of ice loss from the Greenland ice sheet has very likely substantially increased … over the period 1992–2001. The average rate of ice loss from the Antarctic ice sheet has likely increased … over the period 1992–2001. There is very high confidence that these losses are mainly from the northern Antarctic Peninsula and the Amundsen Sea sector of West Antarctica.

    There is high confidence that permafrost temperatures have increased in most regions since the early 1980s. Observed warming was up to 3°C in parts of Northern Alaska (early 1980s to mid-2000s) and up to 2°C in parts of the Russian European North (1971–2010). In the latter region, a considerable reduction in permafrost thickness and areal extent has been observed over the period 1975–2005 (medium confidence).

    Multiple lines of evidence support very substantial Arctic warming since the mid-20th century.

    Sea Level

    The rate of sea level rise since the mid-19th century has been larger than the mean rate during the previous two millennia (high confidence). Over the period 1901–2010, global mean sea level rose by 0.19 [0.17 to 0.21] m.

    Since the early 1970s, glacier mass loss and ocean thermal expansion from warming together explain about 75% of the observed global mean sea level rise (high confidence). Over the period 1993–2010, global mean sea level rise is, with high confidence, consistent with the sum of the observed contributions from ocean thermal expansion due to warming, from changes in glaciers, Greenland ice sheet, Antarctic ice sheet, and land water storage. 

    Carbon and Other Biogeochemical Cycles

    The atmospheric concentrations of carbon dioxide (CO2), methane, and nitrous oxide have increased to levels unprecedented in at least the last 800,000 years. CO2 concentrations have increased by 40% since pre-industrial times, primarily from fossil fuel emissions and secondarily from net land use change emissions. The ocean has absorbed about 30% of the emitted anthropogenic carbon dioxide, causing ocean acidification.

    From 1750 to 2011, CO2 emissions from fossil fuel combustion and cement production have released 365 [335 to 395] GtC [gigatonnes – one gigatonne equals 1,000,000,000 metric tonnes] to the atmosphere, while deforestation and other land use change are estimated to have released 180 [100 to 260] GtC.

    Of these cumulative anthropogenic CO2 emissions, 240 [230 to 250] GtC have accumulated in the atmosphere, 155 [125 to 185] GtC have been taken up by the ocean and 150 [60 to 240] GtC have accumulated in natural terrestrial ecosystems. 

    Drivers of Climate Change

    The total natural RF [radiative forcing – the difference between the energy received by the Earth and that which it radiates back into space] from solar irradiance changes and stratospheric volcanic aerosols made only a small contribution to the net radiative forcing throughout the last century, except for brief periods after large volcanic eruptions.

    Understanding the Climate System and its Recent Changes

    Compared to AR4, more detailed and longer observations and improved climate models now enable the attribution of a human contribution to detected changes in more climate system components.

    Human influence on the climate system is clear. This is evident from the increasing greenhouse gas concentrations in the atmosphere, positive radiative forcing, observed warming, and understanding of the climate system.

    Evaluation of Climate Models

    Climate models have improved since the AR4. Models reproduce observed continental-scale surface temperature patterns and trends over many decades, including the more rapid warming since the mid-20th century and the cooling immediately following large volcanic eruptions (very high confidence).

    The long-term climate model simulations show a trend in global-mean surface temperature from 1951 to 2012 that agrees with the observed trend (very high confidence). There are, however, differences between simulated and observed trends over periods as short as 10 to 15 years (e.g., 1998 to 2012).

    The observed reduction in surface warming trend over the period 1998–2012 as compared to the period 1951–2012, is due in roughly equal measure to a reduced trend in radiative forcing and a cooling contribution from internal variability, which includes a possible redistribution of heat within the ocean (medium confidence). The reduced trend in radiative forcing is primarily due to volcanic eruptions and the timing of the downward phase of the 11-year solar cycle.

    Climate models now include more cloud and aerosol processes, and their interactions, than at the time of the AR4, but there remains low confidence in the representation and quantification of these processes in models.

    The equilibrium climate sensitivity quantifies the response of the climate system to constant radiative forcing on multi-century time scales. It is defined as the change in global mean surface temperature at equilibrium that is caused by a doubling of the atmospheric CO2 concentration.

    Equilibrium climate sensitivity is likely in the range 1.5°C to 4.5°C (high confidence), extremely unlikely less than 1°C (high confidence), and very unlikely greater than 6°C (medium confidence). The lower temperature limit of the assessed likely range is thus less than the 2°C in the AR4, but the upper limit is the same. This assessment reflects improved understanding, the extended temperature record in the atmosphere and ocean, and new estimates of radiative forcing. 

    Detection and Attribution of Climate Change

    Human influence has been detected in warming of the atmosphere and the ocean, in changes in the global water cycle, in reductions in snow and ice, in global mean sea level rise, and in changes in some climate extremes. This evidence for human influence has grown since AR4. It is extremely likely that human influence has been the dominant cause of the observed warming since the mid-20th century.

    It is extremely likely that more than half of the observed increase in global average surface temperature from 1951 to 2010 was caused by the anthropogenic increase in greenhouse gas concentrations and other anthropogenic forcings together. The best estimate of the human-induced contribution to warming is similar to the observed warming over this period. 

    Future Global and Regional Climate Change

    Continued emissions of greenhouse gases will cause further warming and changes in all components of the climate system. Limiting climate change will require substantial and sustained reductions of greenhouse gas emissions.

    The global ocean will continue to warm during the 21st century. Heat will penetrate from the surface to the deep ocean and affect ocean circulation.

    It is very likely that the Arctic sea ice cover will continue to shrink and thin and that Northern Hemisphere spring snow cover will decrease during the 21st century as global mean surface temperature rises. Global glacier volume will further decrease.

    Global mean sea level will continue to rise during the 21st century. Under all RCP scenarios the rate of sea level rise will very likely exceed that observed during 1971–2010 due to increased ocean warming and increased loss of mass from glaciers and ice sheets.

    Sea level rise will not be uniform. By the end of the 21st century, it is very likely that sea level will rise in more than about 95% of the ocean area. About 70% of the coastlines worldwide are projected to experience sea level change within 20% of the global mean sea level change.

    Climate change will affect carbon cycle processes in a way that will exacerbate the increase of CO2 in the atmosphere (high confidence). Further uptake of carbon by the ocean will increase ocean acidification.

    Cumulative emissions of CO2 largely determine global mean surface warming by the late 21st century and beyond. Most aspects of climate change will persist for many centuries even if emissions of CO2 are stopped. This represents a substantial multi-century climate change commitment created by past, present and future emissions of CO2.

    A large fraction of anthropogenic climate change resulting from CO2 emissions is irreversible on a multi-century to millennial time scale, except in the case of a large net removal of CO2 from the atmosphere over a sustained period.

    Surface temperatures will remain approximately constant at elevated levels for many centuries after a complete cessation of net anthropogenic CO2 emissions. Due to the long time scales of heat transfer from the ocean surface to depth, ocean warming will continue for centuries. Depending on the scenario, about 15 to 40% of emitted CO2 will remain in the atmosphere longer than 1,000 years.

    Sustained mass loss by ice sheets would cause larger sea level rise, and some part of the mass loss might be irreversible. There is high confidence that sustained warming greater than some threshold would lead to the near-complete loss of the Greenland ice sheet over a millennium or more, causing a global mean sea level rise of up to 7 m.

    Current estimates indicate that the threshold is greater than about 1°C (low confidence) but less than about 4°C (medium confidence) global mean warming with respect to pre-industrial. Abrupt and irreversible ice loss from a potential instability of marine-based sectors of the Antarctic Ice Sheet in response to climate forcing is possible, but current evidence and understanding is insufficient to make a quantitative assessment.

    Methods that aim to deliberately alter the climate system to counter climate change, termed geoengineering, have been proposed. Limited evidence precludes a comprehensive quantitative assessment of both Solar Radiation Management (SRM) and Carbon Dioxide Removal (CDR) and their impact on the climate system.

    CDR methods have biogeochemical and technological limitations to their potential on a global scale. There is insufficient knowledge to quantify how much CO2 emissions could be partially offset by CDR on a century timescale.

    Modelling indicates that SRM methods, if realizable, have the potential to substantially offset a global temperature rise, but they would also modify the global water cycle, and would not reduce ocean acidification.

    If SRM were terminated for any reason, there is high confidence that global surface temperatures would rise very rapidly to values consistent with the greenhouse gas forcing. CDR and SRM methods