October 03, 2013
The Changing Party Composition of the Senate
The two tables below summarise the party composition of the old and new Senate, and also show the change in Senate representation for each state. Results are pending a declaration of the result in Western Australia, the declaration having been delayed by a re-count request.
| Continuing | 2013 Election | Senate Composition | ||||
|---|---|---|---|---|---|---|
| Party | Senators | Until 30 June | Post 1 July | Current | New | Change |
| Coalition | 16 | 18 | 17 | 34 | 33 | -1 |
| Labor Party | 13 | 18 | 13 | 31 | 26 | -5 |
| Greens | 6 | 3 | 3 | 9 | 9 | .. |
| Nick Xenophon | .. | 1 | 1 | 1 | 1 | .. |
| Democratic Labour Party | 1 | .. | .. | 1 | 1 | .. |
| Palmer United Party | .. | .. | 3 | .. | 3 | +3 |
| Family First | .. | .. | 1 | .. | 1 | +1 |
| Liberal Democratic Party | .. | .. | 1 | .. | 1 | +1 |
| Motoring Enthusisats Party | .. | .. | 1 | .. | 1 | +1 |
The table below summarises the changing composition of Senators from each state and territory.
| NSW | Labor Senators Bob Carr and Doug Cameron re-elected, third Senator Ursula Stephens defeated Coalition Senators Marise Payne (Liberal), John Williams (National) and Arthur Sinodinos (Liberal) re-elected David Leyonhjelm (Liberal Democratic Party) elected Net change Liberal Democrats gain one seat from Labor on 1 July 2014 |
| VIC | Labor Senators Gavin Marshall and Jacinta Collins re-elected, third Senator Mehmet Tillem defeated. Tillem was elected by the Parliament of Victoria on 21 August to replace David Feeney who resigned to successfully contest Batman at the House of Representatives election. Tillem has yet to be sworn in, but will take his seat at the first sitting despite his defeat and hold it until 30 June 2014. Liberal Senators Mitch Fifield and Scott Ryan re-elected. third Liberal candidate Helen Kroger defeated Janet Rice (Green) elected Ricky Muir (Australian Motoring Enthusiasts Party) elected Net Change Greens gain a seat from Labor and Australian Motoring Enthusiasts gain a seat from the Liberal Party on 1 July 2014. |
| QLD | Labor Senator Claire Moore re-elected, John Hogg did not contest election, Mark Furner defeated and new Senator Chris Ketter elected LNP Senator Ian Macdonald re-elected, Ron Boswell and Sue Boyce did not contest election, while James McGrath and Matthew Canavan are newly elected Glenn Lazarus elected for Palmer United Party Net Change Palmer United Party gain a seat from Labor on 1 July 2014. |
| WA | Liberal Senators Michaelia Cash and David Johnston were re-elected, Alan Aggleston did not contest election and Linda Reynolds was elected in his place Labor Senator Louise Pratt re-elected, Mark Bishop did not contest election and Joe Bullock was elected in his place Green Senator Scott Ludlam defeated Zenhya Wang (Palmer United Party) elected Net Change Palmer United Party gain a seat from the Greens on 1 July 2014 |
| SA | Labor Senator Penny Wong re-elected, Don Farrell defeated Liberal Senators Cory Bernardi and Simon Birmingham re-elected Independent Senator Nick Xenophon re-elected Green Senator Sarah Hanson-Young re-elected Bob Day (Family First) elected Net Change Family First gain a Senator from Labor on 1 July 2014 |
| TAS | Labor Senators Catryna Bilyk and Carol Brown re-elected, third Senator Lin Thorp defeated Liberal Senators David Bushby and Rickard Colbeck re-elected Green Senator Peter Whish-Wilson re-elected Jacqui Lambie (Palmer United Party) elected Net Change Palmer United Party gain a seat from Labor |
| ACT | Labor Senator Kate Lundy re-elected Liberal Senator Gary Humphries was defeated for party pre-selection and Zed Seselja has been elected as the new Liberal Senator. Net Change nil. Territory Senators do not have fixed terms, instead taking their seats at the first sitting of the new Parliament. |
| NT | Labor Senator Trish Crossin did not contest the election after being replaced as Labor candidate. Nova Peris is the newly elected Labor Senator. Country Liberal Senator Nigel Scullion was re-elected Net Change nil. Territory Senators do not have fixed terms, instead taking their seats at the first sitting of the new Parliament. |
Posted by Antony Green on October 03, 2013 at 11:34 AM | Permalink
Comments
Post a comment
Comments are moderated, and will not appear until the author has approved them.
Comment below or sign in with Typepad Facebook TwitterGoogle+and more…


 The change in the world’s sea level between 1993 and 2008. Black areas are land; colored are the oceans. Yellow and red regions show rising sea level, while green and blue regions show falling sea level. White regions are missing data during parts of the year. Nearly everywhere, sea level is rising, and the global average is clearly rising fast. But the patterns of sea level change (the regional variations) are complicated.


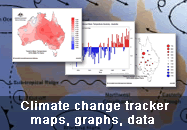
 October 2012 to September 2013 mean temperature deciles for Australia showing 12-month temperatures were the highest on record for 39% of Australia.
 Monthly mean temperature anomalies for September 2012 to September 2013.