
Solar Activity Data And Near Real-Time Solar Images
The sun is the engine of the Earth’s weather. The role of the sun in influencing climate and the various mechanisms that may be involved is a matter of some debate. What is not in doubt is that the sun is going through a particularly quiet patch at the moment. This page gives a snapshot of some of the current data on the sun’s atmosphere, sunspots and magnetic field as well as sharing some fascinating images of the sun at various wavelengths.
Images below are near real-time and are from two instruments on NASA’s Solar Dynamics Observatory (SDO) spacecraft launched in 2010 which keeps a constant eye on the sun. At the foot of each image you can see the date and time that it was recorded (Universal Time (UT) is equivalent to GMT). The graphs below come from NOAA’s Space Weather Prediction Center. There are some notes on the data below the graphs.
Near Real Time Image Of The Sun As Seen Just Now By Instrument’s On NASA’s Solar Dynamics Observatory (SDO) Spacecraft…
 This is the sun as it is about now. The image is in near real time from NASA’s Solar Dynamics Laboratory spacecraft with its Atmospheric Imaging Assemby (AIA) instrument. Courtesy: NASA, SDO.
Latest Data From NOAA’s Space Weather Prediction Center
 Courtesy: NOAA Space Weather Prediction Center
 Courtesy: NOAA Space Weather Prediction Center
 Courtesy: NOAA Space Weather Prediction Center
Data Notes From NOAA’s SWPC
Update Schedule
The Solar Cycle products are updated once a month and are put on-line the first Tuesday after the new values are available. The latest values are usually available on the 3rd of every month.
Terms And Definitions
Observed numbers are simple averages of the daily values for the month.
SWO Sunspot Numbers are issued by the NOAA Space Weather Prediction Center (SWPC) in Boulder Colorado, USA.
The official International Sunspot Number (RI) is issued by the Sunspot Index Data Center (SIDC) in Brussels, Belgium. Data and plots are available from the SIDC web site at http://sidc.oma.be
10.7cm Radio Flux is the preliminary observed value measured in Penticton, B.C. Canada. The values are displayed in solar flux units (1 sfu = 10^-22 W/m^2/Hz).
The Ap Geomagnetic Index is the preliminary estimate calculated by the United States Air Force (USAF).
For daily values, see http://www.swpc.noaa.gov/ftpmenu/indices.html
Daily Solar Data — last 30 days
Daily Solar Data — current quarter
Solar, Particle, and Geomag. Indices beginning Jan. 1994
Smooth values are an average of 13 monthly observed values centered on the month of concern (the 1st and 13th months are given a weight of 0.5).
Ap(avg)=(0.5*Ap(1) +1.0*Ap(2) +1.0*Ap(3)+ … +1.0*Ap(12) +0.5*Ap(13))/12.0
SWPC products use preliminary values. Final values are available through the National Geophysical Data Center (NGDC) at http://www.ngdc.noaa.gov/ normally one to two months later.
The Sun In Near Real-Time As Seen By SDO’s AIA And HMI Instruments
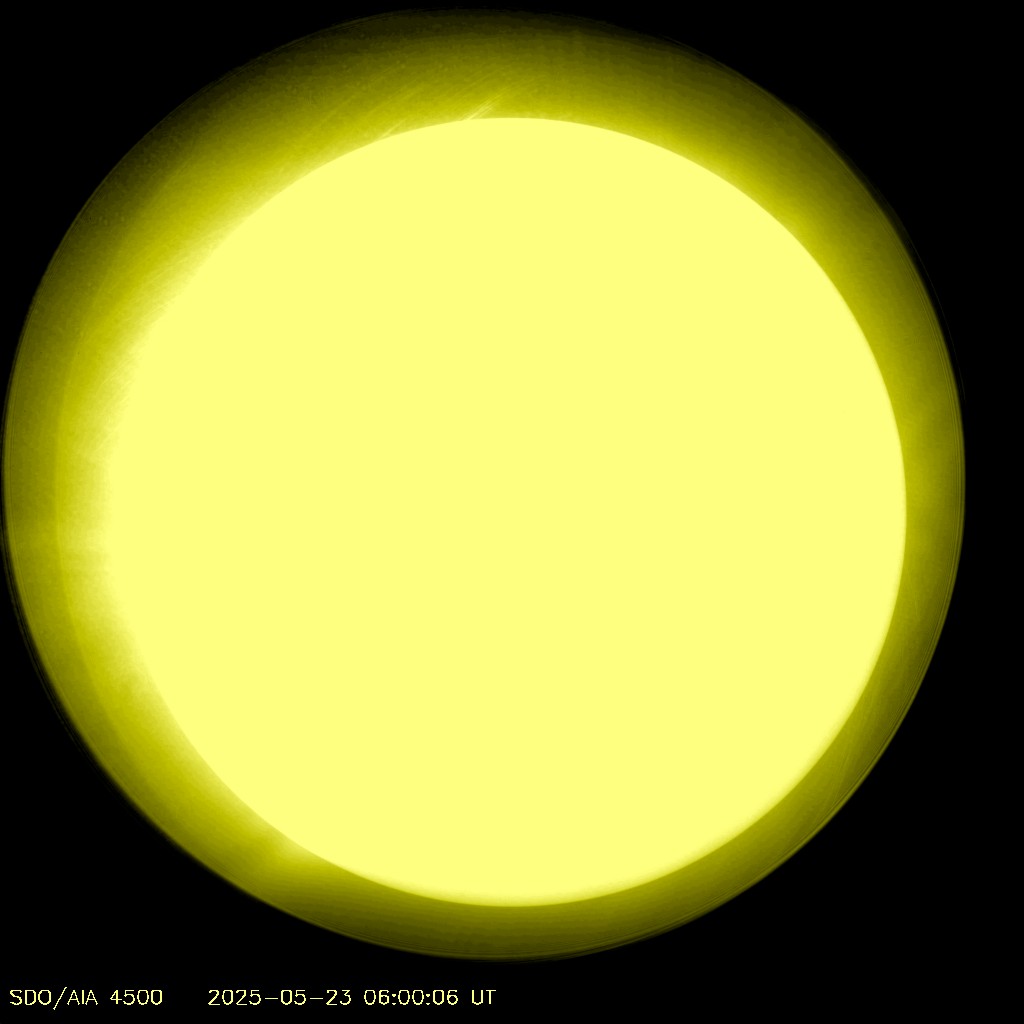
Images below are near real-time and are from two instruments on NASA’s Solar Dynamics Observatory (SDO) space craft launched in 2010 which keeps a constant eye on the sun. The Atmospheric Imaging Assembly (AIA) instrument looks at the solar corona at a variety of wavelengths and you can see those in those images below. The Helioseismic and Magnetic Imager (HMI) is an instrument designed to study oscillations and the magnetic field at the solar surface, called the photosphere. HMI observes the full solar disk at 6173 Å with a resolution of 1 arcsecond. HMI and AIA are two of three instruments on the Solar Dynamics Observatory; together, the SDO’s suite of instruments observes the Sun nearly continuously and takes a terabyte of data a day.
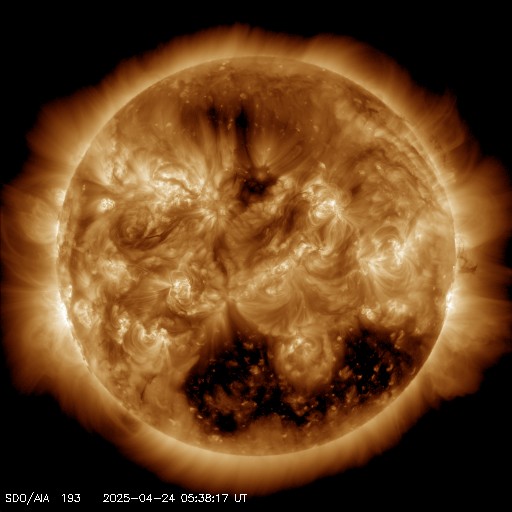
AIA image from space at 0193 Angstrom wavelength
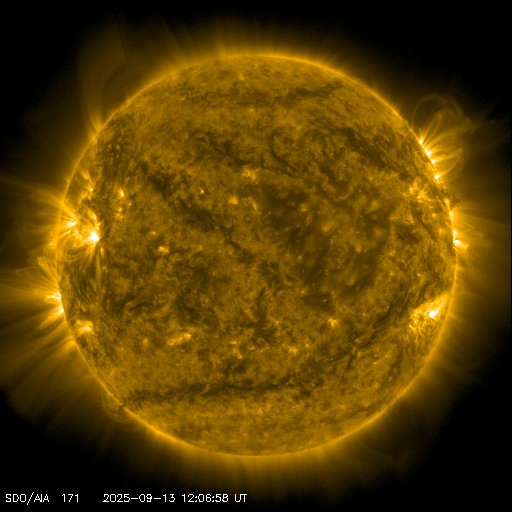
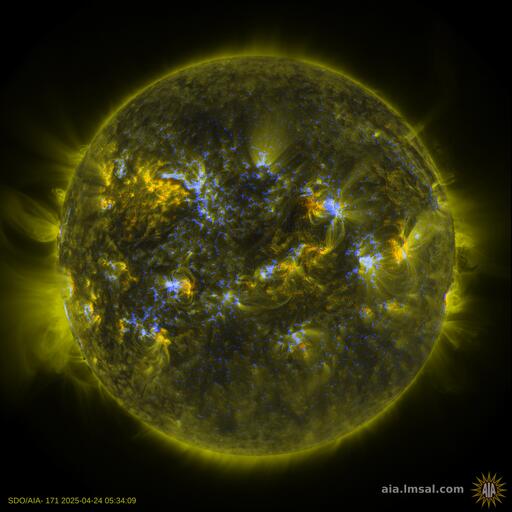
AIA image from space at 0171 Angstrom wavelength
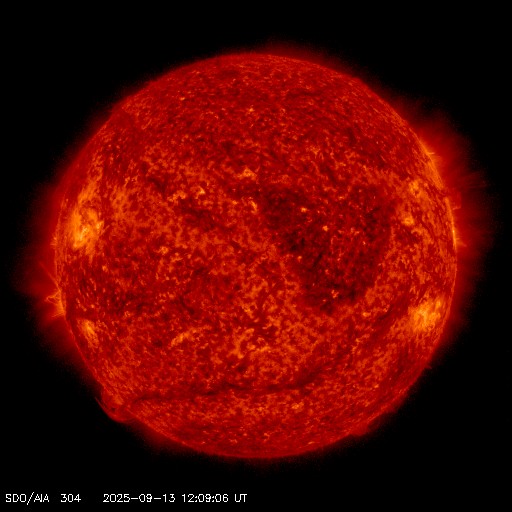
AIA image from space at 0304 Angstrom wavelength
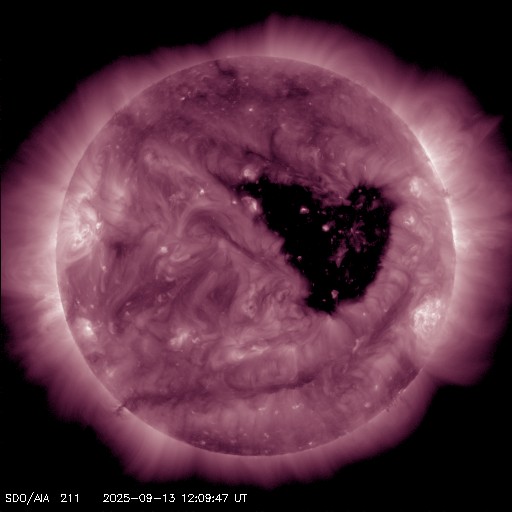
AIA image from space at 0211 Angstrom wavelength
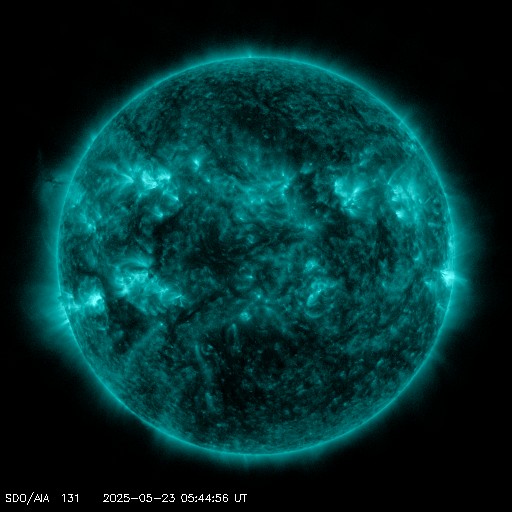
AIA image from space at 0131 Angstrom wavelength
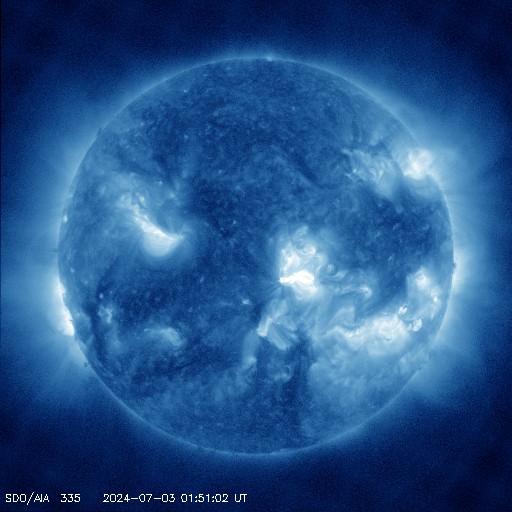
AIA image from space at 0335 Angstrom wavelength
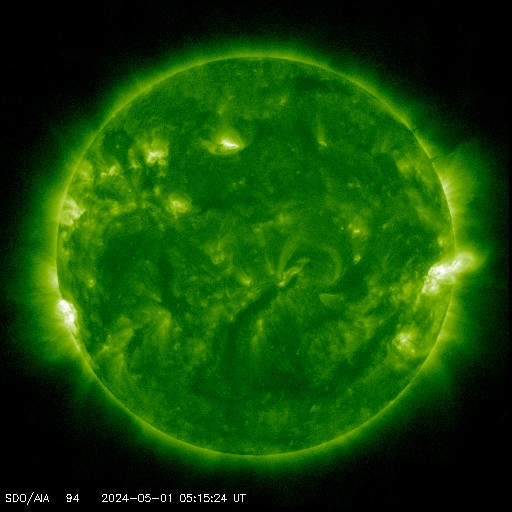
AIA image from space at 094 Angstrom wavelength
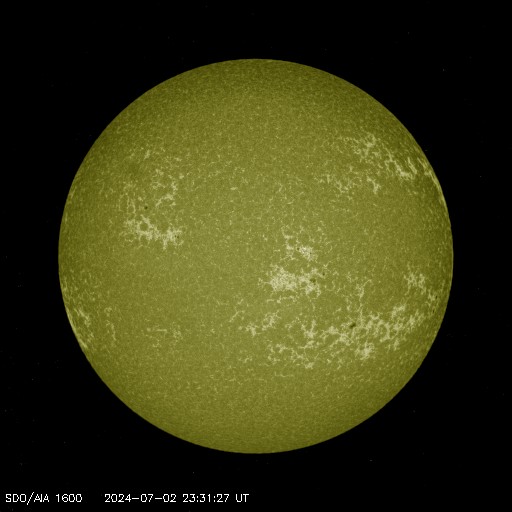
AIA image from space at 1600 Angstrom wavelength
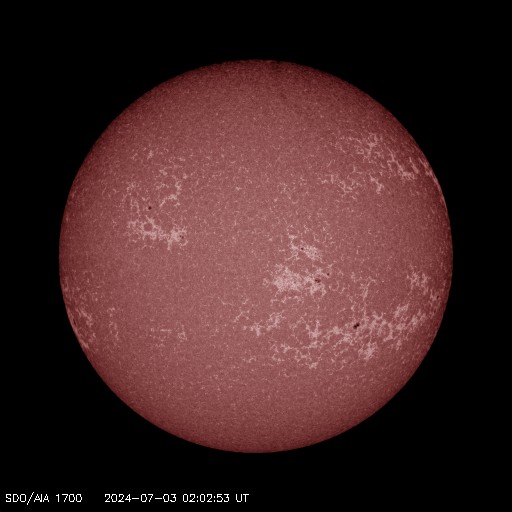
AIA image from space at 1700 Angstrom wavelength
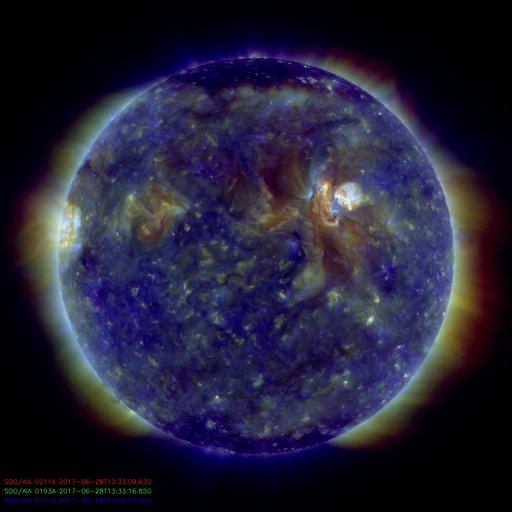
AIA image from space 211, 193, 171 Angstrom wavelengths
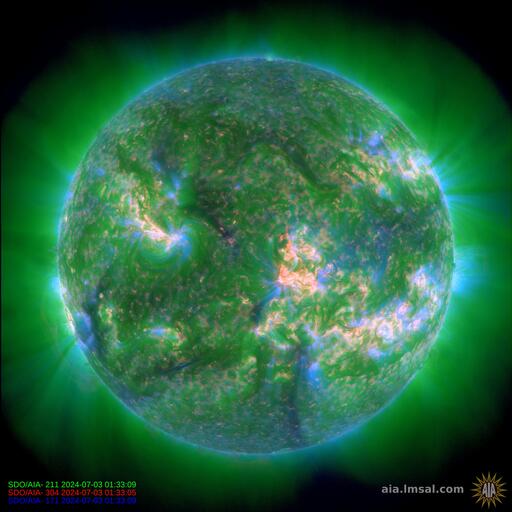
AIA image from space at 304, 211, 171 Angstrom wavelengths
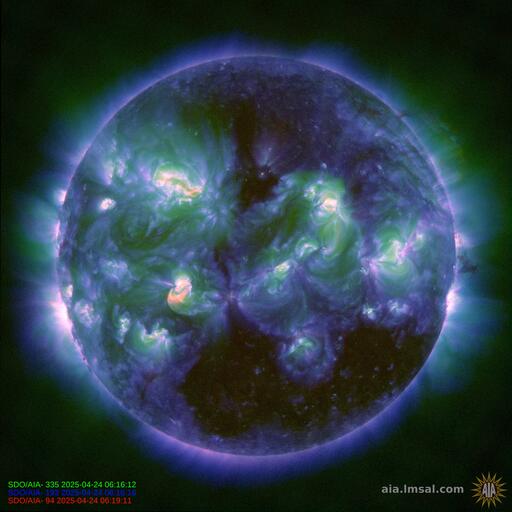
AIA 094, 335, 193
AIA 171 & HMIB
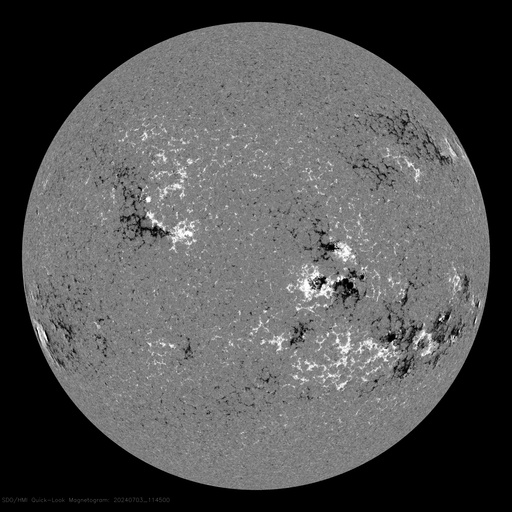
Magnetogram image from SDO’s Helioseismic and Magnetic Imager (HMI) instrument.
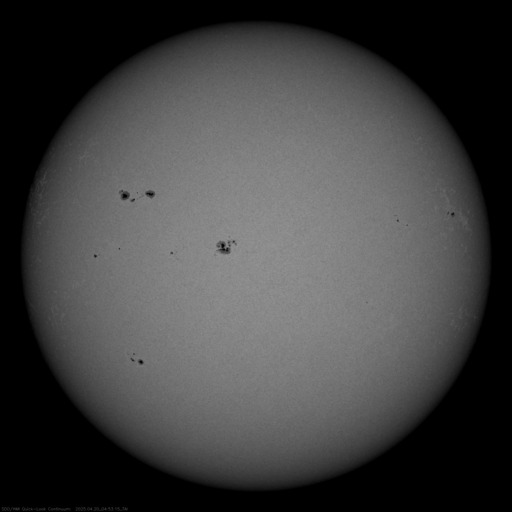
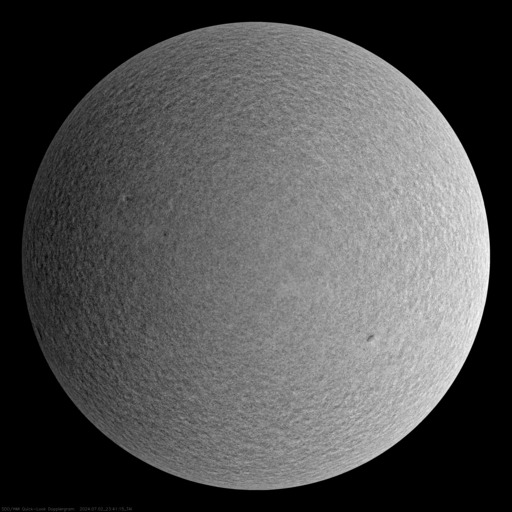
Intensitygram from SDO’s Helioseismic and Magnetic Imager (HMI) instrument that shows the Sun as it would be seen in filtered white light.
Dopplergram image from SDO’s Helioseismic and Magnetic Imager (HMI) instrument. Dopplergrams provide maps of velocity on the sun’s surface and help spot fast moving changes such as flares.
Leave a Reply
You must be logged in to post a comment.