Sea Level Rise ‘Locking In’ Quickly, Cities Threatened
- Published: July 29th, 2013

To embed this interactive, click the preferred size for the code: 700 x 559 | 500 x 399
By Ben Strauss
ANALYSIS
Measurements tell us that global average sea level is currently rising by about 1 inch per decade. But in an invisible shadow process, our long-term sea level rise commitment or “lock-in” — the sea level rise we don’t see now, but which carbon emissions and warming have locked in for later years — is growing 10 times faster, and this growth rate is accelerating.
An international team of scientists led by Anders Levermann recently published a study that found for every degree Fahrenheit of global warming due to carbon pollution, global average sea level will rise by about 4.2 feet in the long run. When multiplied by the current rate of carbon emissions, and the best estimate of global temperature sensitivity to pollution, this translates to a long-term sea level rise commitment that is now growing at about 1 foot per decade.
We have two sea levels: the sea level of today, and the far higher sea level that is already being locked in for some distant tomorrow.
In a new paper published Monday in the Proceedings of the National Academy of Sciences (PNAS), I analyze the growth of the locked-in amount of sea level rise and other implications of Levermann and colleagues’ work. This article and its interactive map are based on this new PNAS paper, and they include extended results.
To begin with, it appears that the amount of carbon pollution to date has already locked in more than 4 feet of sea level rise past today’s levels. That is enough, at high tide, to submerge more than half of today’s population in 316 coastal cities and towns (home to 3.6 million) in the lower 48 states.
By the end of this century, if global climate emissions continue to increase, that may lock in 23 feet of sea level rise, and threaten 1,429 municipalities that would be mostly submerged at high tide. Those cities have a total population of 18 million. But under a very low emissions scenario, our sea level rise commitment might be limited to about 7.5 feet, which would threaten 555 coastal municipalities: some 900 fewer communities than in the higher-emissions scenario.
To develop such figures, I combined my sea level debt findings with analysis from Climate Central’s Surging Seas project, which is a national assessment and mapping of coastal vulnerability in the U.S. based primarily on elevation and census data.
A quick tour of the interactive map on this page shows that Florida is by far the most vulnerable state under any emissions scenario. Louisiana, New Jersey and North Carolina would also face enormous difficulties. If we call a place “threatened” when at least half of today’s population lives below the locked-in future high tide line, then by 2100, under the current emissions trend, more than 100 cities and towns would be threatened in each of these states.
Nationally, the largest threatened cities at this level are Miami, Virginia Beach, Va., Sacramento, Calif., and Jacksonville, Fla.
If we choose 25 percent instead of 50 percent as the threat threshold, the lists all increase, and would include major cities like Boston, Long Beach, Calif., and New York City. The lists shrink if we choose 100 percent as the threshold for calling a community “threatened.”
But each fraction is arbitrary, and true critical levels will depend on geography and economics. Some places when partly or wholly below sea level may be defensible, at least to some degree — like New Orleans with its network of levees and flood barriers. Other places may be indefensible with well under 25 percent of exposure. For example, South Florida will be very difficult to protect, due in large part to the porous bedrock underlying it.
Overall, this analysis does not account for potential engineering solutions; it is based simply on elevations.
The low-emissions scenario could reduce impacts substantially — by almost threefold — but is profoundly ambitious compared to current trends and policy discussions. It includes a halt to global emissions growth by 2020, followed by rapid global emissions reductions, and a massive program to remove carbon from the atmosphere, resulting in net negative emissions — atmospheric clean-up — by late in the century.
The big question hanging over this analysis is how quickly sea levels will rise to the committed levels. Neither Levermann and colleagues’ analysis, nor my new paper, address this question.
In a loose analogy, it is much easier to know that a pile of ice in a warm room will melt, than to know exactly how fast it will melt.
Levermann and company do put an upper limit of 2,000 years on how long it will take the sea level commitments described here to play out. Recent research indicates that warming from carbon emitted today is essentially irreversible on the relevant timescales (in the absence of its massive-scale engineered removal from the atmosphere), and will endure for hundreds or thousands of years, driving this long run unstoppable sea level rise.
On the other hand, our sea level rise commitment may be realized well before two millennia from now. The average rate of global sea level rise during the 20th century was about half a foot per century. The current rate is 1 foot, or twice that. And middle-of-the-road projections point to rates in the vicinity of 5 feet per century by 2100.
Such rates, if sustained, would realize the highest levels of sea level rise contemplated here in hundreds, not thousands of years — fast enough to apply continual pressure, as well as threaten the heritage, and very existence, of coastal communities everywhere.
Related Content
Surging Seas: Sea Level Rise Analysis by Climate Central
Cutting Short-Lived Pollutants Can Slow Sea Level Rise
U.S. Airports Face Increasing Threat From Rising Seas
Rising Sea Level May Trigger Groundwater Floods
Report: Can U.S. Carbon Emissions Keep Falling?
Global Emissions Hit Record High, Report Finds
Stabilization Targets and Irreversible Climate Change
Two Key Climate Change Topics are ‘Misunderstood’
- Posted in Basics, Impacts, Responses, Projections, Climate, Oceans & Coasts, Sea Level, States of Change, United States
Comments
By Eric Peterson (Front Royal, VA 22630)
on July 30th, 2013
“The average rate of global sea level rise during the 20th century was about half a foot per century. The current rate is 1 foot, or twice that”
It is not valid to compare the current decade average to the past century average because the past century had intervals of higher and lower rises. For example, the rate from the 1930’s through the 1940’s was also about twice the 20th century average. Here’s a graph of that: http://en.wikipedia.org/wiki/File:Trends_in_global_average_absolute_sea_level,_1870-2008_(US_EPA).png
By Kay Mann (Orlando, FL 32807)
on July 30th, 2013
my biggest concern/gripe with the global warming talk is that the educated ****** are always trying to make people believe that the problem is ‘man made’ when in fact every planet in our solar system is warming at the same rate as the earth. the common denominator is the sun, not an SUV. anyone who’s ever sat around a camp fire knows that as the flames rise and fall you’ll feel it getting warmer and then cooling. now start paying attention to all the articles about solar activity and you will see images of the flames on the sun leaping out towards the earth and the other planets – there’s your camp fire.
why do they do it? some actually believe the tripe even though the historical evidence doesn’t support it – make note that many of these same ‘educated’ ****** who are selling global warming now were warning us about the quickly approaching ice age back in the 1970’s. but for most of the so called experts, it’s all about the money (just ask al gore who’s making his fortune jet setting around the world deriding people other than himself for burning fossil fuels). some people in the field have realized that in every grant money application they submit, if they mention the term ‘global warming’ they’ll get a warm reception by those who dole out the money. and why do the governments of the world go along with it? it’s the cash cow of all time. the governments can charge fees, taxes, and surcharges to individuals, companies, and a myriad of processes and no one can audit, regulate, or even argue the action without being labeled or demonized as a “climate change denier.”
the idea that a Toyota Land Rover is warming up the Earth, Venus, Saturn, and Uranus, is foolishness. these so called experts spout that CO2 is a major greenhouse gas and that it’s causing the oceans to warm up and forests to die off is ludicrous. in fact what is actually happening is that as the SUN heats up the ocean (remember the solar flares), it kills off plant life and microorganisms in the sea which emit or ‘gas off’ CO2 as they decay. the exact same thing occurs when the sun heats up forests or grass lands; CO2 gas does not cause the vegetation to die off – but rather, as the SUN’s solar activity heats up and kills vegetation, as those greens die off they create, gas off, emanate, or give off CO2 gas as part of the decaying process.
just as the experts were wrong about the coming ice age they ranted about in the 70’s, they’re just wrong about this ‘man made global warming’ spiel. it’s all about the coins, so look out as we’re bowled over by crooked politicians around the world who see the cold hard cash in global warming.
By Steve Ocean
on July 30th, 2013
Global climate change is upon us.
However, projections with such long timelines, e.g.to 2100, are ludicrous. Regardless of what any model may predict, there is no way to know what is actually going to happen in 87 years.
Why not?
Because we humans are the most important variable. The great challenge and opportunity of our age is not just reducing our impact, but pro-active remediation. Just as we can have profound negative effects, we can also have profound positive effects.
Do we know how to “fix” all our mistakes now? No. Can we learn? We are beginning to now. Will we make the needed changes in time? Maybe. We are only “locked in” to an outcome if can’t or won’t make the needed changes.
And therein lies the rub with long term predictions. A well balanced climate, a prosperous garden earth that gracefully sustains us all, is also a possibility. In fact, as we can see from these predictions, it is the only acceptable option.
It will be much better for us to focus on the next 10 years instead of worrying about things at the end of the century. By that time, none of us are going to recognize this place or ourselves anyway, no matter what the climate does.
By Linda Settle (Atlanta, Georgia 30087)
on July 30th, 2013
I don’t care about this being public, but I would REALLY like to understand the maps but I don’t. I am an intelligent person
but I am just guessing when I look at this map. There’s this light blue outline and dots???
By Steve O (Arlington VA 22205)
on July 30th, 2013
Sacramento? That can’t be right. Really? It’s an inland city. The text is unclear, however. Is the reference to a 23 foot rise? If so, then I can accept Sacramento. If the reference is to the 7.5 foot rise, then not.
@Kay Mann – love a good chuckle every day. Thanks!!
(Just a tip: It’s always good to make sure you are up to date before spouting stuff off. It was way back in 2008 that the American Meteorological Society did our homework for us and discovered that scientists were actually NOT predicting an ice age back in the 70’s. Here’s the paper: http://journals.ametsoc.org/doi/pdf/10.1175/2008BAMS2370.1)
By Steve O (Arlington VA 22205)
on July 30th, 2013
@Steve Ocean
You are so correct. The greatest variable in future predictions of climate change is the actions we humans take or don’t.
Many skeptics/deniers will point out the enormous range of predictions in the IPCC reports as some sort of indication that scientists don’t know squat. The large range is not because scientists don’t fundamentally understand how CO2, other gases, land use changes and other factors affect the climate. It’s because they have no idea what our future GHG concentrations will be. The answer to that is up to us.
Unfortunately, we seem to be on the path to testing the high end predictions.
“A well balanced climate, a prosperous garden earth that gracefully sustains us all, is also a possibility. In fact, as we can see from these predictions, it is the only acceptable option.”
Perhaps it’s a possibility, but I see very little evidence it’s a plausible one.
Options: Mitigate, Adapt, Suffer. Those are the three, alone or in combination. There are no others.
By Tom Arnold (Lubbock/Texas)
on July 30th, 2013
Forget the flood predictions, I am particularly concerned about a term used in this article which was simply glossed over but to would have serious ramifications. Did anyone else notice the term “atmosphere cleaning” as part of the “Deep Cuts” scenario? Yikes, they say it as if it is just some simple task we’ll have to do as part of a broader program.
By Bill Hilton (94087)
on July 30th, 2013
Regarding Sacramento, it is indeed an inland city but the Sacramento River is 10-12 ft above sea level and the river bank about 15-18 ft in front of downtown. So with a rise of sea level as predicted in the study, the state legislators will be getting their feet wet every day (the capitol building is about 20 ft above sea level now).
By Gastón (Buenos Aires / Argentina)
on July 30th, 2013
could inform the rest of the cities of the world?
what about Latin American cities?
By Jim Holm (Kalamazoo, MI, 49009)
on July 30th, 2013
Skyscrubber.com is working on a way we can back out of Global Warming.
By Frazer Kirkman (Eden Hills)
on July 31st, 2013
I’d love to see this interactive map, made for the whole world
By gordon neilson (Skokomish Tribe, Washington 98584)
on July 31st, 2013
This is the most severe analysis we have seen to date. In all of the studies we have read concerning sea-level rise we have yet to see any mention of Tribal nations, over 1/2 of Washington State’s Tribes have coastal reservations that will be grossly affected if not devastated by 4’ sea level rise. Why is the case of sea-level rise not inclusive of Tribes who were consigned to these reservations. Although the focus is on municipalities and cities affected I doubt that even their populations have been included in the populations numbers included in this research.
By Dave (Basking Ridge, NJ 07920)
on July 31st, 2013
Regardless of gravitational caveats for high latitudes and absent any discussion of error bars it seems that for most parts of the world, the millennial scale SLR message from this is “more than 4 feet” above current level is fully “locked in” today and this rises to something like 23 feet by 2100 for business as usual.
Although a message is clearly intended, a millennial timeline provides only an intellectual perspective. Even those that consider themselves long range thinkers may be unperturbed upon reflection. In today’s environment coming up with strategies for how to cope with SLR projections out to 2100 is the natural, immediate and currently challenging human objective. Compared with that, planning for the next few thousand years is a fantasy that amounts to planning a new civilization. If this teaches us something new about the curve on the nearer term then I have obviously missed that point. But for now I can’t see that it does – although academically it is interesting.
By Byron Rot (Sequim/WA/98032)
on July 31st, 2013
The attached website offers better data and insight into the sun is also warming other planets idea Kay raises, see http://www.skepticalscience.com/global-warming-other-planets-solar-system.htm
By ACMESalesRep (Vancouver)
on July 31st, 2013
Kay Mann: You’re wrong. Global warming is man-made – that is what the available evidence tells us. The educated “experts” – that is the word you refused to type, right? – are experts for a reason. They know more than uneducated rubes do. That’s what being an expert entails. You’re merely spouting the same talking points that the oil industry and other special-interest groups with vested interests in denying climate change have used for years to try to divert attention from the actual facts.
You don’t know more than the experts. Please don’t be so arrogant as to think you do.
By john werneken (vancouver wa 98661)
on August 1st, 2013
So what. 4 million people can move easier than 4 billion can give up progress and prosperity.
By Robert W Easton (02863)
on August 1st, 2013
How did you miss Providence, Rhode Island?? RI is, Ironically, The Ocean State, and much of it would be gone in your worst-case scenario. The coast of Connecticut as well, but neither are in danger on your list
By Anon (Texas)
on August 1st, 2013
Dumb! “So what. 4 million people can move easier than 4 billion can give up progress and prosperity.” The largest percentage of that which produces ‘progress and prosperity’ is also on the ‘sinker’ list.
By Don (Melbourne, FL, 32935)
on August 1st, 2013
Look at this from a scientific point of view. I have yet to see any model, and all of this is based on modeling, that can be shown as being biase-free. The creators of the models play with the numbers to make the model produce the result they want.
Extraordinary claims require solid evidence and while there is evidence for some warming, I have seen no compelling evidence that man-made carbon dioxide is the call.
By Skeptic (Madison, WI 53217)
on August 1st, 2013
This is from the same folks who can’t forecast tomorrow’s weather. The “experts” have zero credibility, only a huge desire to collect government welfare checks disguised as grants.
By Doug (Burlingame, CA 94010)
on August 1st, 2013
@Kay Mann. I’d posit that there is much more money to be made in being a climate change denying scientist than in being the opposite. Furthermore, the new ice age story from the 70s had legs for about two months, if that.
By Kevin Cody (64803)
on August 2nd, 2013
what about chicago and the great lakes?
how will snow pack melt affect the great lakes, please?
By Khannea SunTzu (Voorburg)
on August 2nd, 2013
Unless someone develops life extension and rejuvenation treatments why should I give a damn? I’ll be dead by the end of the century.
Let the unborn deal with this crap. Not my concern.
By Paul Budline (Princeton)
on August 2nd, 2013
“Warmer World Likely to be More Violent,” reads one headline, while another warns of impending Noah-like (or is it NOAA??) flooding. Am I more likely to be stabbed to death or drown? Please advise … and quickly!
Also, when perusing your “Who We Are” section I found myself wondering whether there are any alarmists of color. Very very monochromatic staff.
By IQ Matters (San Francisco, CA)
on August 2nd, 2013
Another silly, silly misinterpretation of badly accululated data. Hurry! Change society to match my beliefs! If you don’t you will all die. DIE! Hurry! Change! Give me money to run another biased study!!
This is nothing but fanatics pushing their religion.
By Richard A Karlin (Pittsburgh)
on August 2nd, 2013
Kay Mann is bothered by the “man made” tag. It does not matter Kay. If the ice melts, the waters rise and our cities drown (review New Orleans for reference) it is a problem, man made or not. I know of no scientifically vetted data whatsoever that shows any other planet warming. Are you getting this from scientists or from Fox News. In the past, the sun has warmed, and what you describe has happened, but many things can happen in more than one way. One hundred years ago we would not have been able to take an accurate sun temperature. Today we can, and I assure you, it has not gone up in the past few decades.
In summary, the ice on earth is melting, by observation not by guessing. The CO2 in the atmosphere is rising, by measurement, not by guesses or opinions. We have burned about 1/2 of earth’s oil supply in 50-100 years. These three things fit together in harmony. That is the reality, which of course some will reject, but that always happens.
By Richard A Karlin (Pittsburgh)
on August 2nd, 2013
In the past, warming from a hotter sun has caused CO2 to rise by warming and thus out-gassing, the oceans. In the present, CO2 is up in both air and water, so no out-gassing! In the past, sun temperature was largely a guess. In the present, we get very accurate sun temperature readings.
Our present binge burning of oil, natural gas, coal, and wood is in lock step with the CO2 increase. Of course, we could try to blame it on the plants, but that fixes nothing. Melting ice is in lock step with warming.
All models have errors. The actual water rise may be more or less than the models predict, but rise it shall, and this is a big problem. Crop maladjustments and disease spread are other warming problems.
We can fix them all by shifting to improved nuclear and nuclear based electric, plus some for-real recycling (not the current charade)!! The result can be an increase in standard of living. Worldwide flooding is a decrease, as is crop failures and disease spread!! Your choice!!
By Richard A Karlin (Pittsburgh)
on August 2nd, 2013
Okay Kay Mann. The following is from your post of July 30:
“when in fact every planet in our solar system is warming at the same rate as the earth”
It is fessup time. Tell us where you got this absurd and totally false statement from!!
By Paul Zorka (honolulu, hawaii 96822)
on August 3rd, 2013
where does hawaii factor in here?
By Don (Denver/CO/80212)
on August 3rd, 2013
Helpful hint: Anyone who cannot comment without making a derisive reference to Al Gore is probably a troll.
By Fred (Memphis, TN)
on August 3rd, 2013
Junk science.
By Leslie Graham
on August 4th, 2013
“…So what. 4 million people can move easier than 4 billion can give up progress and prosperity….”
There’s more than that in London alone – something like 20 million in Bangladesh.
And who is talking about “…giving up progress and prosperity….”!!? Only deniers who don’t have a clue what is happening here.
One of the first things that climate change is going to wreck is YOUR standard of living. And that’s because you’re one of the lucky ones who doesn’t depend on what you grow for yourself.
If you check the stats the figures suggest exactly the opposite of what you are suggesting.
Those countries that have embraced the renewables industrial revolution are the very same countries whose economies are expanding the fastest.
The US is being leapfrogged by China, India, Brazil, South Korea, Germany and even Mexico in the fastest expanding industrial sector on the planet bar none.
If the US is backward enough to invest heavily in carbon assets they are going to see the biggest crash in history when that carbon bubble bursts, And make no mistake – it will burst. Now that climate change is obvious the markets are already getting nervous. The oil companies alone stand to lose six trillion in stranded assets.
Put your money in renewables – it’s a no-brainer in the long term.
By John Barltrop (Adelaide South Australia)
on August 4th, 2013
There are a lot of comments by so called intelligent people………..HOWEVER, it is apparent that they have no idea about how to use the the interactive maps and see exactly what is being pointed out in this particular article.
I would also recommend that you listen to what intelligent scientists have to say say instead of feeding off each others repetetive BS and get your head out of the sand and realise what is going in the world and not just in your own dung hill!
By James Hazelton (Sydney, Australia)
on August 7th, 2013
Misleading graphic. My first thought from the chart was that you’re predicting a 23ft sea level increase by the year 2100, which sounds absurd. It took me a minute to figure out you’re forecasting that by 2100 we’ll potentially have committed to a (forecasted) 23ft sea level rise to be realised by some 2000 years in the future. Forecasting forecasts is like two errors having sex, and not quite how the article is presenting the results.
I recently saw a doco on James Balog who does epic interyear timelapse of glacier melts, recording undoubtable evidence. He makes the point that science is usually bad at conveying the evidence, which leads to induce unnecessary debate and often just confusing the general public – ^^ case in point.
By Craig (Miami)
on August 8th, 2013
I’ve lived in Miami 40 years and I can tell you the sea level has not risen 4”.
These tree huggers view data with blinders on, obviously its for their own financial gain.
If one looks at the data from the last 10,000 year, the fact is, the sea level has risen over 100 METERS , yes meters, not talking inches. The rise of C02 in the atmosphere is mostly the result of the warming not the cause of it. Almost all of the CO2 in the atmostphere is the result of releases from the oceans, The solubility of CO2 in the water decreases as the temperature rises. Thus we have rising C02 levels that follow temperature rise. NOT the other way around.
By Ken (Westminster, MD)
on August 9th, 2013
@ Craig
“These tree huggers view data with blinders on, obviously its for their own financial gain.”
I had no idea the Koch brothers were tree huggers. Man, you opened my eyes.
By Josh Barnes (Honolulu/Hawaii/96816)
on August 12th, 2013
How about adding Hawaii and Alaska to the map?
By cwolf88 (VA 23188)
on August 13th, 2013
I’d rather see the map as terrain elevations. Obviously there are mountains on both the east and west coasts that would affect what gets flooded.
Clearly some areas are flooding today.
Going to be interesting. At a minimum, it’ll keep the trolls busy. The entire point (what causes climate change) may be moot; afterall, fossil fuels will run out at some point. If water doesn’t run out first (the aquifers are dry in some places today).
Or if food doesn’t keep pace with population. They’re projecting 400 million in the US.
By Haraldur Sigurdsson (Stykkisholmur/Iceland)
on August 13th, 2013
It is a shame that such good scientists are still working with Fahrenheit and Inches and feet. Maybe one day…
By Anna ( California)
on August 13th, 2013
Climate Central needs a comment bot, to address misinformation (and to spare human readers the need to take time to do so). Name it Jeeves?
By Guest
on August 13th, 2013
Why no world map? It seems to be a key problem of US journalism that they always take this narrow-minded focus on so many issues that are global.
By James Kelly (TRACY)
on August 13th, 2013
When Is big flood going to start in california
My mother house is in san lorenzo ca.
one mile the Bay 25 feet above sea level
during minus tide parts of the water would be so low
that you can walk out on mud several hundred feet
I have not been out their lately but
low tides were low and high tides were high
during seasons
the tide was higher than usual
but seasons come and seasons go
and the seas do not appear to be any higher
than they were before 50 years ago
if you just look at them with your eyes
By actuator
on August 13th, 2013
The amount of CO2 we humans contribute to the atmosphere is about 3.5 percent of the total. That being the case how is it possible that reducing that measly contribution will have a significant impact on climate when any attempt at reduction will make life much more difficult for most of humanity. As Craig states and as ice core studies going back hundreds of thousands of years have shown, warming precedes increasing CO2. The big problem with climate modeling is that no one knows all the variables, cycles, variations in cycles, etc., etc., etc. that impact climate and for that reason alone when anyone makes a long term prediction for future climate it fails. But those who depend on grants for sustaining their existence know full well that they must cry ‘catastrophe is coming’ and generate something for the politicians to protect us from to keep the cash flowing.
- The Global Energy Assessment – Chapter 11: Renewable Energy
- The Global Energy Assessment – Chapter 12: Fossil Energy Systems
- The Global Energy Assessment – Chapter 17: Energy Pathways for Sustainable Development
- Coal and Biomass to Fuels and Power
- Making Fischer-Tropsch Fuels and Electricity from Coal and Biomass: Performance and Cost Analysis
Gallery
 Difference in poison ivy growth between recent conditions and a CO2-enriched environment.

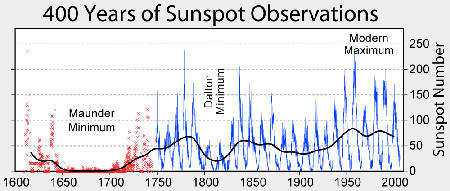 400 years of sunspot observations data. Created by Robert Rohde, via Wikipedia.Relative to current levels, the Dalton Minimum represents a 0.08% decrease in the amount of solar radiation reaching the Earth’s surface, and the Maunder Minimum represents a 0.25% decline. That’s how stable solar activity is. That’s also why we’re playing with fire by increasing the greenhouse effect so much and so quickly. We’re threatening the stability of the climate that has been so favorable to our development.
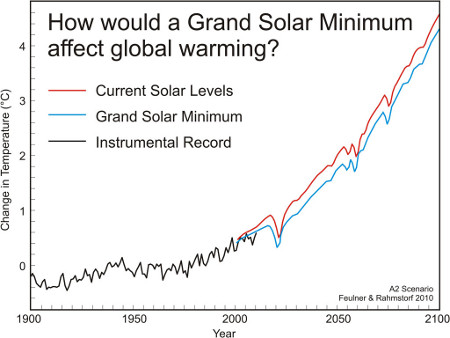 The global mean temperature difference is shown for the time period 1900 to 2100 for the IPCC A2 emissions scenario. The red line shows predicted temperature change for the current level of solar activity, the blue line shows predicted temperature change for solar activity at the much lower level of the Maunder Minimum, and the black line shows observed temperatures through 2010. Adapted from Feulner & Rahmstorf (2010) by SkepticalScience.com
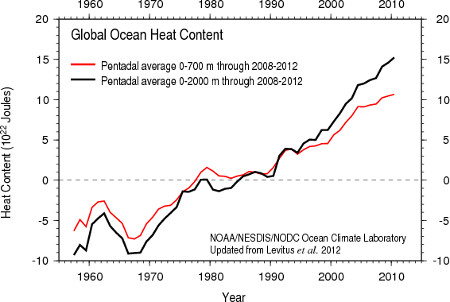 5-year averages of ocean heat content 0-700 meters (red) and 0-2000 meters (black), from the National Oceanographic Data CenterBut let’s address the question anyway – do we expect to have seen some obvious indication of heat being transferred from the shallow to deep ocean layers?


 Connect


