Category: Uncategorized

  • Soil Biodiversity Will Be Crucial to Future Land Management and Response to Climate Change

    Soil Biodiversity Will Be Crucial to Future Land Management and Response to Climate Change

    Aug. 12, 2013 — Research by scientists at The University of Manchester and Lancaster shows maintaining healthy soil biodiversity can play an important role in optimising land management programmes to reap benefits from the living soil. The findings, published in the latest edition of the journal PNAS, extend the understanding about the factors that regulate soil biodiversity.


    Share This:

    The team says more research on soil food webs — the community of organisms living all or part of their lives in the soil — and their response to land use and climate change could also improve predictions of climate change impacts on ecosystems.

    In one of the largest studies of its kind, a team of researchers from across Europe looked at soil life in 60 sites across four countries, the UK, Sweden, Greece and the Czech Republic, to assess the role of soil food webs in nutrient cycles in agricultural soils. Soil food webs describe the community of organisms living all or part of their lives in the soil and their complex living system interacting with other substances such as carbon and nitrogen. The study shows for the first time that there is a strong link between soil organisms and the overall functioning of ecosystems.

    Until now most studies which have investigated the reduction of soil biodiversity and how this affects carbon and nitrogen cycling have been laboratory-based or focused on one group of organisms in the soil rather than the wider picture. This is the first time researchers have looked at the entire community of organisms. The team explored soil found under land used in various ways including intensive wheat rotation farming and permanent grassland. It found there were consistent links between soil organisms and soil food web properties and ecosystem functioning on a large scale, across European countries.

    Dr Franciska De vries, from The University of Manchester’s Faculty of Life Sciences who was lead author of the research, said: “We found that the condition of the soil was less tied to how the land was used and more influenced by the soil food web properties.

    “Soils contain a vast diversity of organisms which are crucially important for humans. These organisms help capture carbon dioxide (CO2) which is crucial for helping to reduce global warming and climate change.

    “This research highlights the importance of soil organisms and demonstrates that there is a whole world beneath our feet, inhabited by small creatures that we can’t even see most of the time. By liberating nitrogen for plant growth and locking up carbon in the soil they play an important role in supporting life on Earth.”

    The researchers hope the findings will help in predicting how land use and climate change will impact on ecosystems and looking at ways to minimise negative changes.

    Dr De vries, from The University of Manchester who carried out the research while at Lancaster University, said: “Soil biodiversity is under threat by a range of pressures such as urbanisation, climate change, pollution and expanding production of food, fibre and biofuel but the topic remains severely understudied.

    “We hope that this research will in the longer term will help us to devise ways for farmers, landowners and conservation agencies to optimise the way they manage land to reap benefits from the living soil and reduce carbon emissions.”

    Share this story on Facebook, Twitter, and Google:
  • Timing a Rise in Sea Level

    Timing a Rise in Sea Level

    NASA, via Reuters

    The fast-retreating Sheldon Glacier in Antarctica. A collapse of a polar ice sheet could result in a jump in sea level.

    By
    Published: August 12, 2013
    • Facebook
    • Twitter
    • Google+
    • Save
    • E-mail
    • Share
    • Print
    • Reprints

    Thirty-five years ago, a scientist named John H. Mercer issued a warning. By then it was already becoming clear that human emissions would warm the earth, and Dr. Mercer had begun thinking deeply about the consequences.

    His paper, in the journal Nature, was titled “West Antarctic Ice Sheet and CO2 Greenhouse Effect: A Threat of Disaster.” In it, Dr. Mercer pointed out the unusual topography of the ice sheet sitting over the western part of Antarctica. Much of it is below sea level, in a sort of bowl, and he said that a climatic warming could cause the whole thing to degrade rapidly on a geologic time scale, leading to a possible rise in sea level of 16 feet.

    While it is clear by now that we are in the early stages of what is likely to be a substantial rise in sea level, we still do not know if Dr. Mercer was right about a dangerous instability that could cause that rise to happen rapidly, in geologic time. We may be getting closer to figuring that out. An intriguing new paper comes from Michael J. O’Leary of Curtin University in Australia and five colleagues scattered around the world. Dr. O’Leary has spent more than a decade exploring the remote western coast of Australia, considered one of the best places in the world to study sea levels of the past.

    The paper, published July 28 in Nature Geoscience, focuses on a warm period in the earth’s history that preceded the most recent ice age. In that epoch, sometimes called the Eemian, the planetary temperature was similar to levels we may see in coming decades as a result of human emissions, so it is considered a possible indicator of things to come.

    Examining elevated fossil beaches and coral reefs along more than a thousand miles of coast, Dr. O’Leary’s group confirmed something we pretty much already knew. In the warmer world of the Eemian, sea level stabilized for several thousand years at about 10 to 12 feet above modern sea level.

    The interesting part is what happened after that. Dr. O’Leary’s group found what they consider to be compelling evidence that near the end of the Eemian, sea level jumped by another 17 feet or so, to settle at close to 30 feet above the modern level, before beginning to fall as the ice age set in.

    In an interview, Dr. O’Leary told me he was confident that the 17-foot jump happened in less than a thousand years — how much less, he cannot be sure.

    This finding is something of a vindication for one member of the team, a North Carolina field geologist, Paul J. Hearty. He had argued for decades that the rock record suggested a jump of this sort, but only recently have measurement and modeling techniques reached the level of precision needed to nail the case.

    We have to see if their results withstand critical scrutiny. A sea-level scientist not involved in the work, Andrea Dutton of the University of Florida, said the paper had failed to disclose enough detailed information about the field sites to allow her to judge the overall conclusion. But if the work does hold up, the implications are profound. The only possible explanation for such a large, rapid jump in sea level is the catastrophic collapse of a polar ice sheet, on either Greenland or Antarctica.

    Dr. O’Leary is not prepared to say which; figuring that out is the group’s next project. But a 17-foot rise in less than a thousand years, a geologic instant, has to mean that one or both ice sheets contain some profound instability that can be set off by a warmer climate.

    That, of course, augurs poorly for humans. Scientists at Stanford calculated recently that human emissions are causing the climate to change many times faster than at any point since the dinosaurs died out. We are pushing the climate system so hard that, if the ice sheets do have a threshold of some kind, we stand a good chance of exceeding it.

    Another recent paper, by Anders Levermann of the Potsdam Institute for Climate Impact Research in Germany and a half-dozen colleagues, implies that even if emissions were to stop tomorrow, we have probably locked in several feet of sea level rise over the long term.

    Benjamin Strauss and his colleagues at Climate Central, an independent group of scientists and journalists in Princeton, that reports climate research, translated the Levermann results into graphical form, and showed the difference it could make if we launched an aggressive program to control emissions. By 2100, their calculations suggest, continuing on our current path would mean locking in a long-term sea level rise of 23 feet, but aggressive emission cuts could limit that to seven feet.

    If you are the mayor of Miami or of a beach town in New Jersey, you may be asking yourself: Exactly how long is all this going to take to play out?

    On that crucial point, alas, our science is still nearly blind. Scientists can look at the rocks and see indisputable evidence of jumps in sea level, and they can associate those with relatively modest increases in global temperature. But the nature of the evidence is such that it is hard to tell the difference between something that happened in a thousand years and something that happened in a hundred.

    On the human time scale, of course, that is all the difference in the world. If sea level is going to rise by, say, 30 feet over several thousand years, that is quite a lot of time to adjust — to pull back from the beaches, to reinforce major cities, and to develop technologies to help us cope.

    But if sea level is capable of rising several feet per century, as Dr. O’Leary’s paper would seem to imply and as many other scientists believe, then babies being born now could live to see the early stages of a global calamity.

    A version of this article appeared in print on August 13, 2013, on page D6 of the New York edition with the headline: Timing a Rise in Sea Level.
  • Japan Breaks National Heat Record. Chinese Heat Wave Continues

    Weather Extremes

    Posted by: Christopher C. Burt, 8:48 PM GMT on August 12, 2013 +4

    Japan Breaks National Heat Record. Chinese Heat Wave Continues

    An all-time national heat record was set in Japan today (August 12th) when the temperature peaked at 41.0°C (105.8°F) at the Ekawasaki site in Shimanto (part of Kochi Prefecture). The previous record of 40.9°C (105.6°F) was recorded at Tajima and Kumagaya on August 16, 2007. Tokyo endured its warmest daily minimum on August 11th with a low of 30.4°C (86.7°F). This was the 2nd warmest minimum on record for Japan following a minimum of 30.8°C (87.4°F) at Itoigawa on August 22, 1990.

    Location of Shimanto on the island of Honshu in Japan. Wikipedia.

    How many have died as a result of the Chinese heat wave?

    On Sunday, August 11th, the temperature peaked at 42.7°C (108.9°F) at Shengxian, its hottest temperature measured so far during the heat wave. At Hangzhou the temperature reached 41.1°C (106.0°F) on August 11th and 40.3°C (104.5°F) on August 12th marking the 12th day since July 24th that the city surpassed or tied its previous all-time record high of 40.3° set on August 1, 2003.

    Eastern China, where about 30% of the population of the country and 5% of the global population reside (approximately 400 million people) has undergone a heat wave unprecedented in its history. No one really knows how many have died as a result of the heat wave (Chinese news sources claim ‘about two dozen’), but statistically it is almost certain that many thousands must have perished as the result of the heat over the past month.

    The populous cities of China must be almost unendurable during long summer heat waves. On top of the extreme daily maximum temperatures of the past month, the minimums have also been in record-breaking territory. Health officials site that the lack of night time cooling ultimately leads to high mortality rates during heat waves. Photo from Wikicommons.

    Virtually every possible heat statistic has been broken for most sites in eastern China (as well as central and southern Japan, and South Korea). I cannot think of any other heat event that has affected so many people for so long (including those that plagued the U.S. in the mid 1930s, Russia in 2010, and Western Europe in August 2003). Obviously, the Chinese authorities are keeping the fatalities from this ongoing event under wraps. The European heat wave of 2003 killed over 72,000 people, the Russian heat wave of 2010 killed over 55,000, and in the U.S historical record, we know that many thousands also succumbed to the heat waves of the mid-1930s and in 1995 in the Midwest. The dense population of cities like Shanghai, Hangzhou, Ningbo, and Changsha (these three metropolitan areas accounting for 50 million people) and the fact that many if not most have no air-conditioning and are also unofficial immigrants from rural areas (meaning that if they died in the heat wave, their deaths would not be reported as local urban fatalities) leads one to the conclusion that a major catastrophe must be taking place.

    It is difficult to properly estimate the number of fatalities as a result of excessive heat. In the West the estimates are mostly derived from examining mortality statistics and comparing how many anomalous deaths occurred during a heat period compared to what would normally have been observed. This was how the figures for the deaths in Europe in 2003, Russia in 2010, and the U.S. in 1995 were ascertained. Obviously, this has not (yet) been undertaken in China. The Chinese authorities are notoriously tight-lipped when it comes to mass casualty natural disasters fearing, I would surmise, that releasing statistics of such might cause unnecessary panic. Often subtle hints must be looked for in official press releases such as this statement recently released by the government-owned Xinhua news agency : Several have died of heat strokes already, including construction workers, many of whom are migrants with limited health care benefits. The mortality rate for heat strokes could be as high as 50%-70% due to lack of timely treatment.

    One thing to keep in mind, however, is that it is ALWAYS hot and humid in eastern China during the summer (unlike Russia and Western Europe), so perhaps the population has learned to adapt to extreme heat.

    This graphic displays how heat is the deadliest weather event in the U.S., accounting for 29% of all weather-related fatalities during the period of 1995-2012. It is, therefore, inconceivable that the death toll from the current heat wave in China is only ‘a c

  • Global warming, Arctic ice loss, and armchair scientists

    Global warming, Arctic ice loss, and armchair scientists

    Armchair scientist Neven provides valuable insights into the rapid decline of Arctic sea ice

    Arctic sea ice

    Arctic sea ice image from NASA. Photograph: HO/AFP/Getty Images

    As humans put more and more heat-trapping gases into the atmosphere, the Earth’s climate changes; we all know that. Some of the trickier questions are, how fast is it changing, what can we expect in the future, what are the costs of slowing emissions (compared to the costs of doing nothing), and what changes are we already observing that give us such confidence in our predictions?

    Perhaps the poster child of climate change is in the Arctic, where sea ice has been declining at an astonishing rate. Over the past few decades, satellite information has been gathered which shows huge declines in ice extent (the area covered by ice). The declines are enough that it is possible that in a few years, there will be little or no ice left in the Arctic at the end of the melt season.

    If the loss of ice area wasn’t bad enough, the volume of ice has decreased faster than the area. By some measures, the volume of ice has decreased approximately 75% over the past 3 decades, since adequate records began to be kept.

    For climate nerds like me, internet bookmarks are essential for organizations like the National Snow and Ice Data Center (NSIDC) or IARC-JAXA which provide updated and high-quality information about Arctic conditions.

     Summer Arctic ice extent, National Snow and Ice Data Center. 
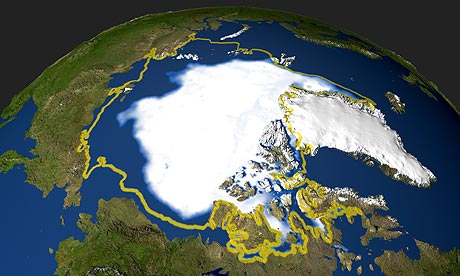
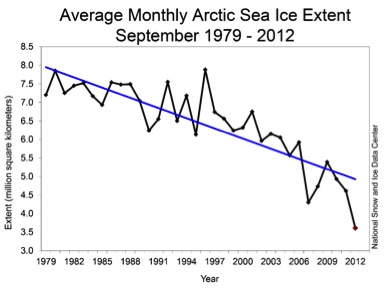
Summer Arctic ice extent, National Snow and Ice Data Center.While these institutions gather and make available important Arctic information, a wider community has taken a very active role in interpreting the data. These “armchair” scientists play a particularly important role in telling the rest of us what the data actually means for our future.

    Perhaps the best example is the Arctic Sea Ice blog which was started in 2010 by Neven, a 38 year old freelance writer who set up the blog to draw more attention to the Arctic and create a central place for the exchange of information and ideas concerning Arctic sea ice. He also set up the Arctic Sea Ice Graphs website that is a collection of graphs, maps and other pieces of information regarding Arctic sea ice, and he formed a forum to allow community discussion.

    Neven, like many other armchair scientists has little formal training. But, he makes up for that with a doggedness that would impress anyone. While he describes his blog as basically weather reports, many publishing researchers turn to him for a comprehensive view of current conditions. Do you want to know what the short term ice conditions will likely be? Ask Neven. Interested in learning about impacts of current conditions on the atmosphere? Ask Neven.

    Not only is he a great resource, but the commenters provide insightful thoughts as well. And very often, they are not in agreement with each other. It is refreshing to see people engage in polite yet candid discussions of various views of our Arctic.

    Ice sheet melt pond – John Maurer NSIDC 
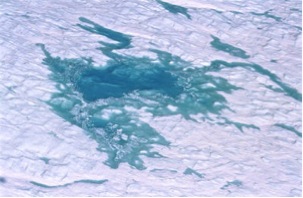
Ice sheet melt pond – John Maurer NSIDCSo, what is the view of the current Arctic conditions? Well, let’s hear from Neven himself.

    “So far the 2013 melting season hasn’t been as spectacular as 2012 because of a slow start to the melting season, where a persistent cyclone kept the Arctic cold and cloudy for several weeks in a row. Right now, it doesn’t look like the 2012 records will be broken, but there are a few known unknowns out there that might change all that. For instance, a large patch of low concentration ice near the North Pole.

    Either way, we’re going to learn something from this melting season, like how important a fast/slow start to the melting season can be in this new regime where most of the ice pack consists of thin first-year ice. The weather used to be the dominant factor in determining how low the minimum would turn out. It still is dominant, but the thinning of the ice pack has reduced its importance. In other words, ice thickness decides how dominant the weather can be.

    If it turns out that a slow start to the melting season results in a recovery of sorts, and we have a couple of those in a row (which I think is highly unlikely), we could return to the pre-2007 situation. But just one bad year would probably throw the ice pack back to where we are now: a state where a fast start to the melting season, and prevailing conditions that are conducive to melt lead to a virtually ice-free Arctic in September.

    I personally believe this could happen before the decade is out, but it still depends on the circumstances. We haven’t reached the stage yet where an ice-free September is a done deal. Things rarely are certain in the Arctic. There even could be some unforeseen negative feedback kicking in and (finally) slowing things down, but that’s not something I would bet the farm on.

    What’s important to remember, is that even if not ice-free, the situation is already very, very bad, and it’s not unreasonable to think that we have started to experience the consequences of the loss of Arctic sea ice so far. Organizations like Greenpeace tell us that we need to save the Arctic. And even though the Arctic is the most important place in the world right now (IMO), it’s not about saving the Arctic, it’s about saving ourselves.”

    People like Neven, who can provide clear descriptions to the larger public are doing a great service. This is particularly so because scientists who are employed at major research institutions are often not trained in communication and such activities are not rewarded. I view these complementary activities and viewpoints an exciting development in the larger conversation about climate change.

  • Extreme weather events on the rise

    Extreme weather events on the rise

    Photo of the cyclone that swept across Lennox Head in 2010, by Josh Lambie, 11 years old.
    Photo of the cyclone that swept across Lennox Head in 2010, by Josh Lambie, 11 years old.

    EXTREME weather events will increase in magnitude and frequency as a result of climate change, a Senate inquiry has found, and the North Coast will suffer from more cyclonic weather, storms, king tides and coastal erosion.

    The inquiry, Recent trends in and preparedness for extreme weather events, released its findings this week.

    It has recommended better co-ordination between governments and community service groups when dealing with extreme weather.

    Taxes and levies to insurance should be removed as part of a national reform process, and reliable flood mapping for land-owners should be developed.

    More research into the link between climate change and extreme weather events was also needed.

    Southern Cross University Professor of Geography Dr Bill Boyd agreed it was “highly likely” that extreme weather events would increase.

    “There is good evidence that an area such as the North Coast will be affected more by cyclonic weather,” he said.

    “We already experience tail ends of tropical cyclones.

    “I would expect this will be more common in the future, as the cyclones track further south or become more intense.

    “We have also recently experienced increased storminess.

    “It appears that storms have become more frequent, resulting in the coastal zone having less recovery time between storms.

    “Local extreme weather events such as the tornados that hit the Lennox/Byron coast are very hard to predict, so it is unrealistic to expect localised forecasts.”

    Coastal erosion will also continue, Dr Boyd said.

    He said that coastal erosion on sandy coasts normally reverses over time and the beaches recover.

    But if cyclonic or stormy weather happens more frequently, the coast will lose its natural capacity to recover.

    “This will result in the loss of land, especially as the coastal dune system becomes degraded,” he said.

    “Especially vulnerable are coastal spits such as those at Wooli and Belongil.”

    Sea levels will rise and there will be more king tides.

    Dr Boyd said this would flood estuaries and back up drainage systems, causing indirect flooding on the coastal plan.

    “These types of change will affect the most densely populated parts of the North Coast, putting pressure on coastal land use and development,” he said.

    Decisions about development have long-term effects, Dr Boyd said, and planning authorities should make use of the “good and valid” available to model flooding and sea-level rise.

    “The problem is that many areas that would be affected to extreme weather events are already developed,” he said.


  • Climate change first: Ice sheets melt from below (Video)

    Climate change first: Ice sheets melt from below (Video)

    Filmmakers Glen Milner and Ben Hilton create a portrait of a modern Inuit family living in the fearsome North Greenland landscape. (on.aol.com)

    Related Photo:

    Modeled basal ice temperatures of the present-day Greenland Ice Shield across the Summit region, GRIP, and GISP2 indicate borehole locations.

    © A. Petrunin/GFZ used with permission
    Advertisement

    August 11, 2013

    Alexey Petrunin and Irina Rogozhina of IceGeoHeat, an international climate research initiative led by the GFZ German Research Centre for Geosciences, are the first to establish a connection between heat transfer from the mantle beneath the world’s ice sheets and the rate of ice sheet melting. The research was published in the journal Nature Geoscience on Aug. 11, 2013.

    The researchers based their conclusions on a study of the ice sheet in Greenland. The Greenland ice sheet is the oldest and most variable in thickness of all the world’s ice sheets.

    The Greenland ice sheet is important to climate change models because the melting of the Greenland ice sheet accounts for 25 percent of the sea level rise produced by global warming.

    The researchers found that heat transferred through the Earth’s mantle contributes to the melting of the Greenland ice sheet. The melting is not uniform across the ice sheet. The melting that occurs from below in a given area depends on the composition of the mantle in that area.

    The addition of these new findings were added to the most recent and best accepted climate change models and produced more accurate results compared to measurement than have been previously seen.